Fig. 5
Download original image
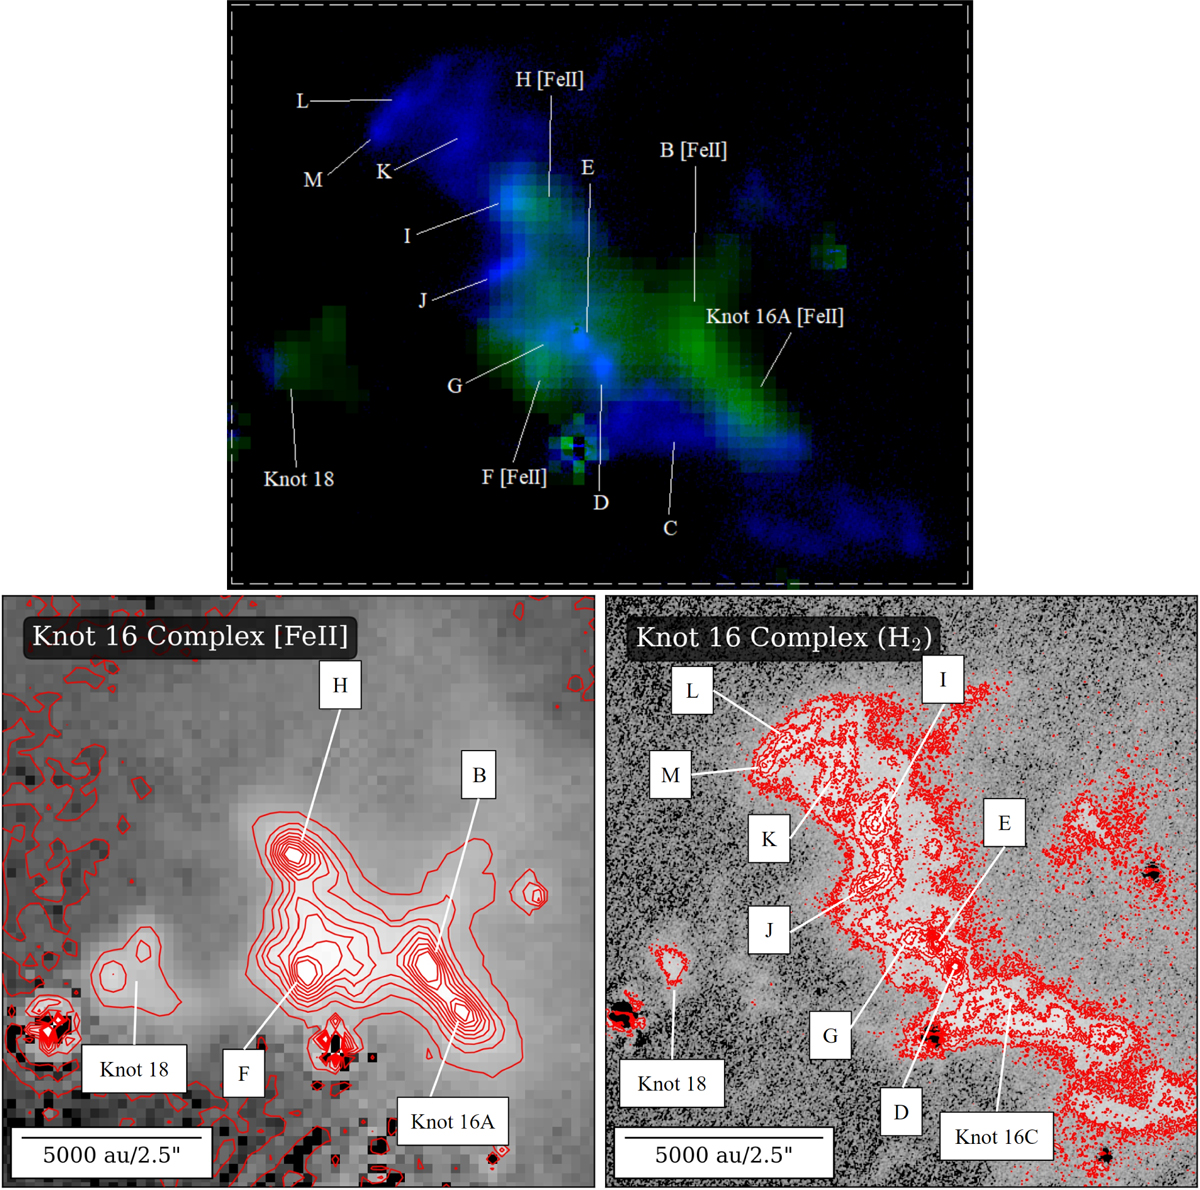
Diagram of the knot 16 complex with all identified features. Top: 2-color continuum-subtracted image of the knot 16 complex, with HST [FeII] emission in green and LUCI-1 SOUL AO H2 emission in blue (see Fig. 4f for reference). Sub-knots are labeled along with knot 18. Sub-knots of the knot 16 complex are identified first in [FeII] and then in H2. Bottom left: significance level contour map for the sub-knots identified in the knot 16 complex from the continuum-subtracted [FeII] data (gray scale image). The contour levels represent values from 5 to 500σ, in steps of 55σ, where σ is the standard deviation sampled from the local background (see Sect. 3.3.2) Bottom right: significance level contour map for the sub-knots identified in the knot 16 complex from the continuum-subtracted H2 data (gray scale image). The contour levels represent values from 5 to 45σ, in steps of 5σ, where σ is the standard deviation sampled from the local background (see Sect. 3.3.2). North is up and east is to the left in all panels.
Current usage metrics show cumulative count of Article Views (full-text article views including HTML views, PDF and ePub downloads, according to the available data) and Abstracts Views on Vision4Press platform.
Data correspond to usage on the plateform after 2015. The current usage metrics is available 48-96 hours after online publication and is updated daily on week days.
Initial download of the metrics may take a while.