Fig. 4
Download original image
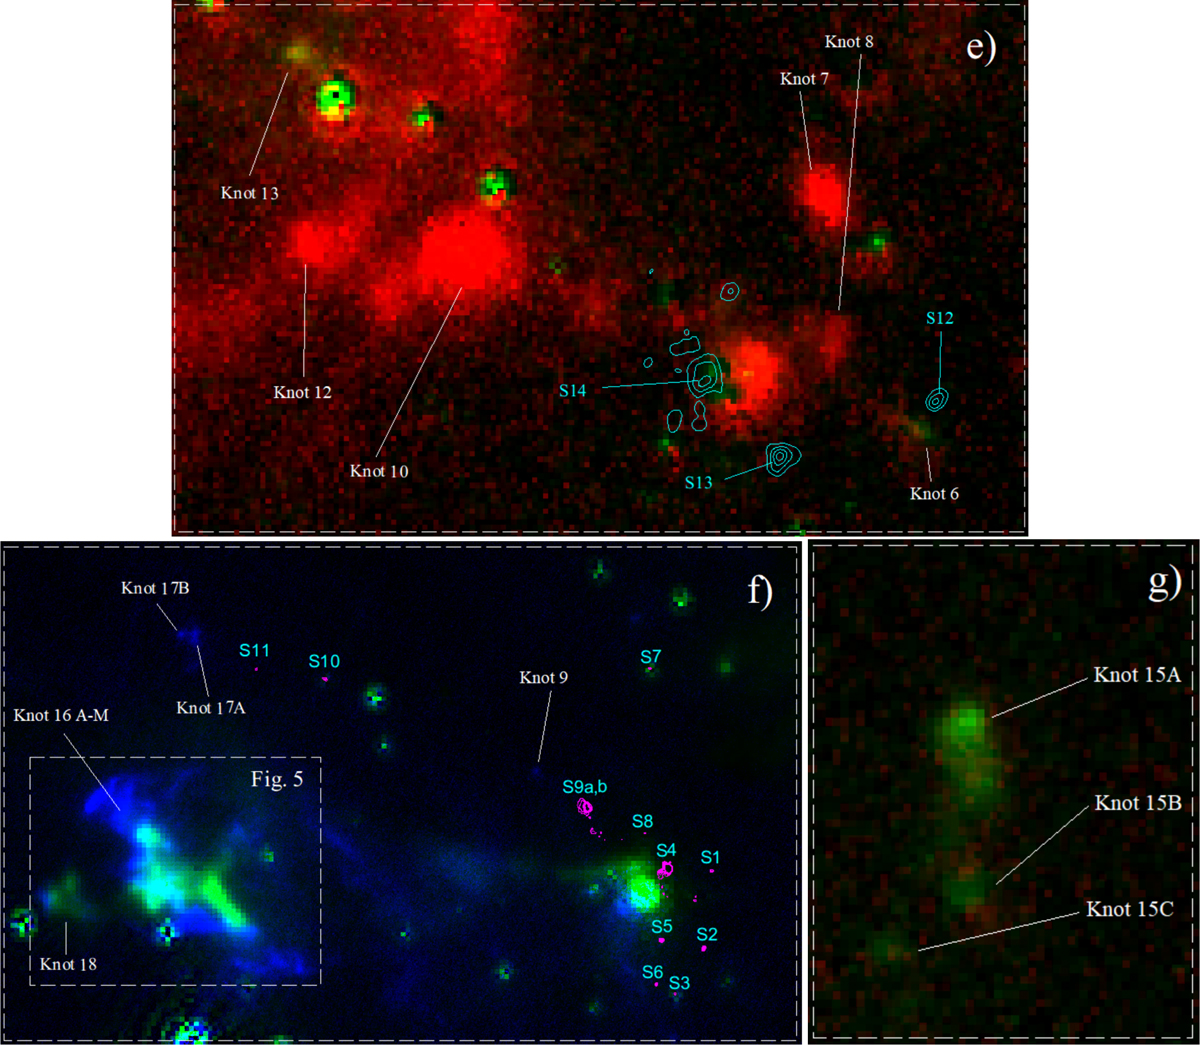
Continued. (e) Magnification of the AFGL 5180 S cluster. Knots and cores are labeled in white and cyan, respectively, and ALMA Band 6 contours are shown in cyan from 5 to 20 σ in steps of 3. (f) Magnification of the main outflowing region around AFGL 5180 M. The H2 seeing-limited data (red) is no longer shown, and instead the LUCI-1 SOUL AO data is shown in blue. The FOV is similar to Fig. 2. Knots and cores are labeled in white and cyan, respectively, and ALMA Band 7 contours are shown in magenta from 5 to 20 σ in steps of 3. The FOV of the knot 16 complex shown in Fig. 5 is shown as the white dotted box. (g) Magnification of the knot 15 complex.
Current usage metrics show cumulative count of Article Views (full-text article views including HTML views, PDF and ePub downloads, according to the available data) and Abstracts Views on Vision4Press platform.
Data correspond to usage on the plateform after 2015. The current usage metrics is available 48-96 hours after online publication and is updated daily on week days.
Initial download of the metrics may take a while.