Fig. 4
Download original image
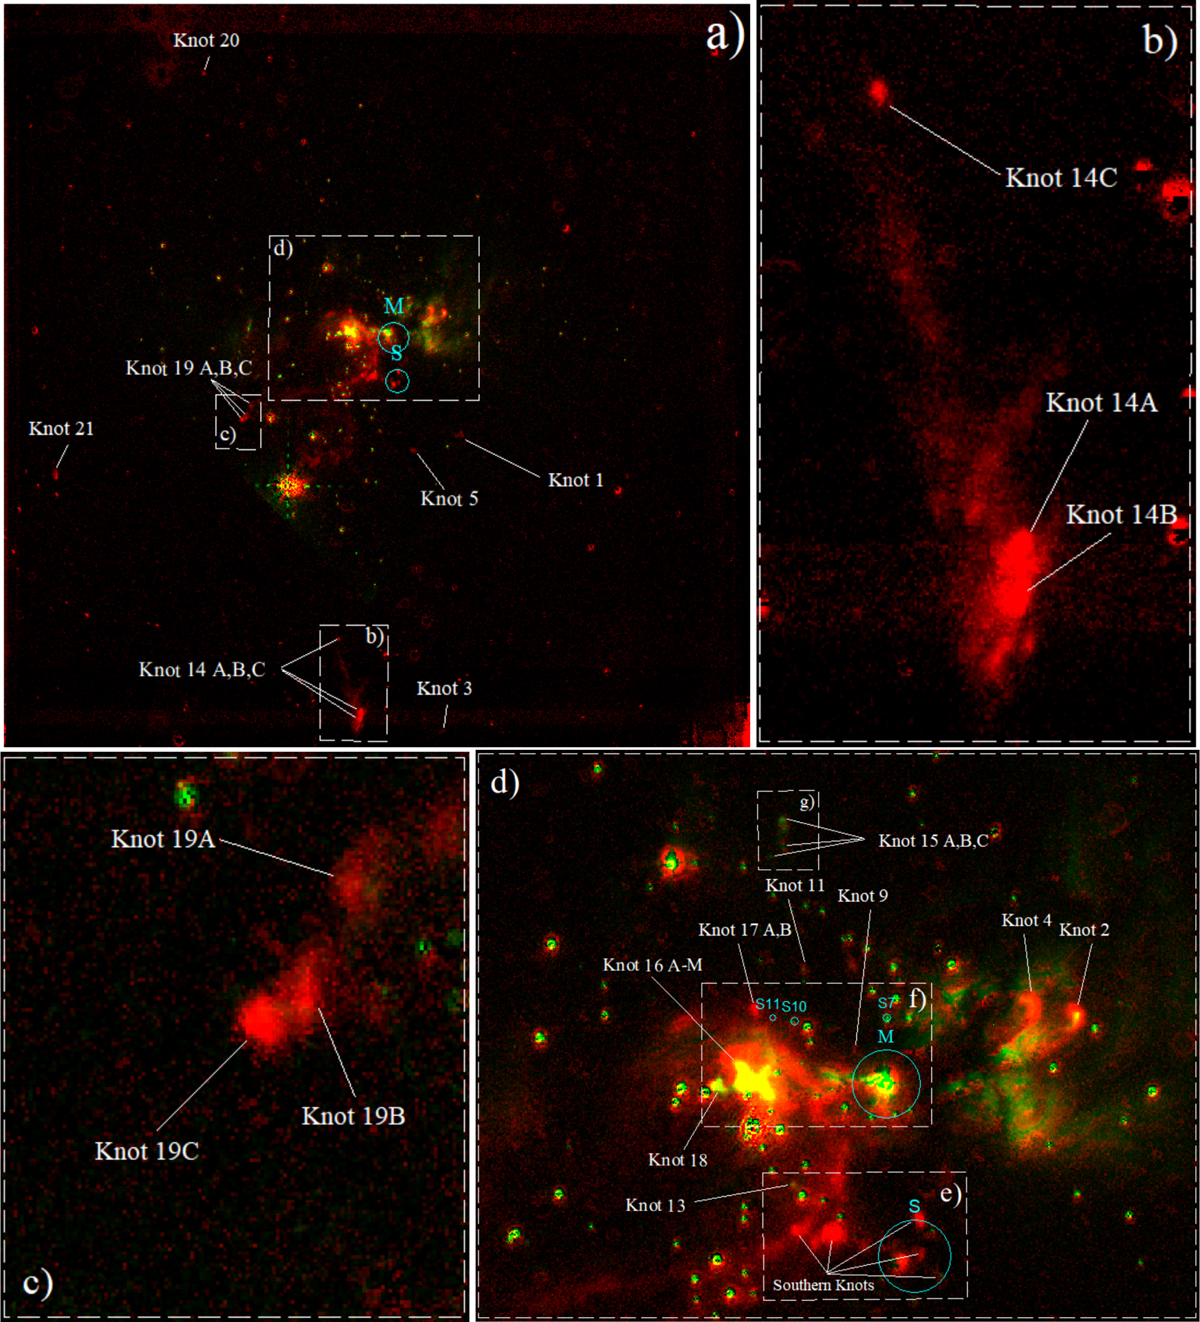
Diagram of identified jet features in the continuum-subtracted LBT LUCI H2 data as well as HST [FeII] data; see Table 3. North is up and east is to the left. (a) 2-color image of the AFGL 5180 complex; red is LBT H2 seeing-limited, green is HST [FeII]. The FOV is the same as in Fig. 1. Knots and the locations of the AFGL 5180 M and S complexes are labeled. (b) Magnification of the knot 14 complex. (c) Magnification of the knot 19 complex. (d) Diagram of the inner outflowing region of AFGL 5180. Knots and cores are labeled in white and cyan, respectively. Note the presence of continuum-subtracted stars in the images that are responsible for the spots of dark and bright pixels; see Sect. 3.2.
Current usage metrics show cumulative count of Article Views (full-text article views including HTML views, PDF and ePub downloads, according to the available data) and Abstracts Views on Vision4Press platform.
Data correspond to usage on the plateform after 2015. The current usage metrics is available 48-96 hours after online publication and is updated daily on week days.
Initial download of the metrics may take a while.