Open Access
Fig. B1
Download original image
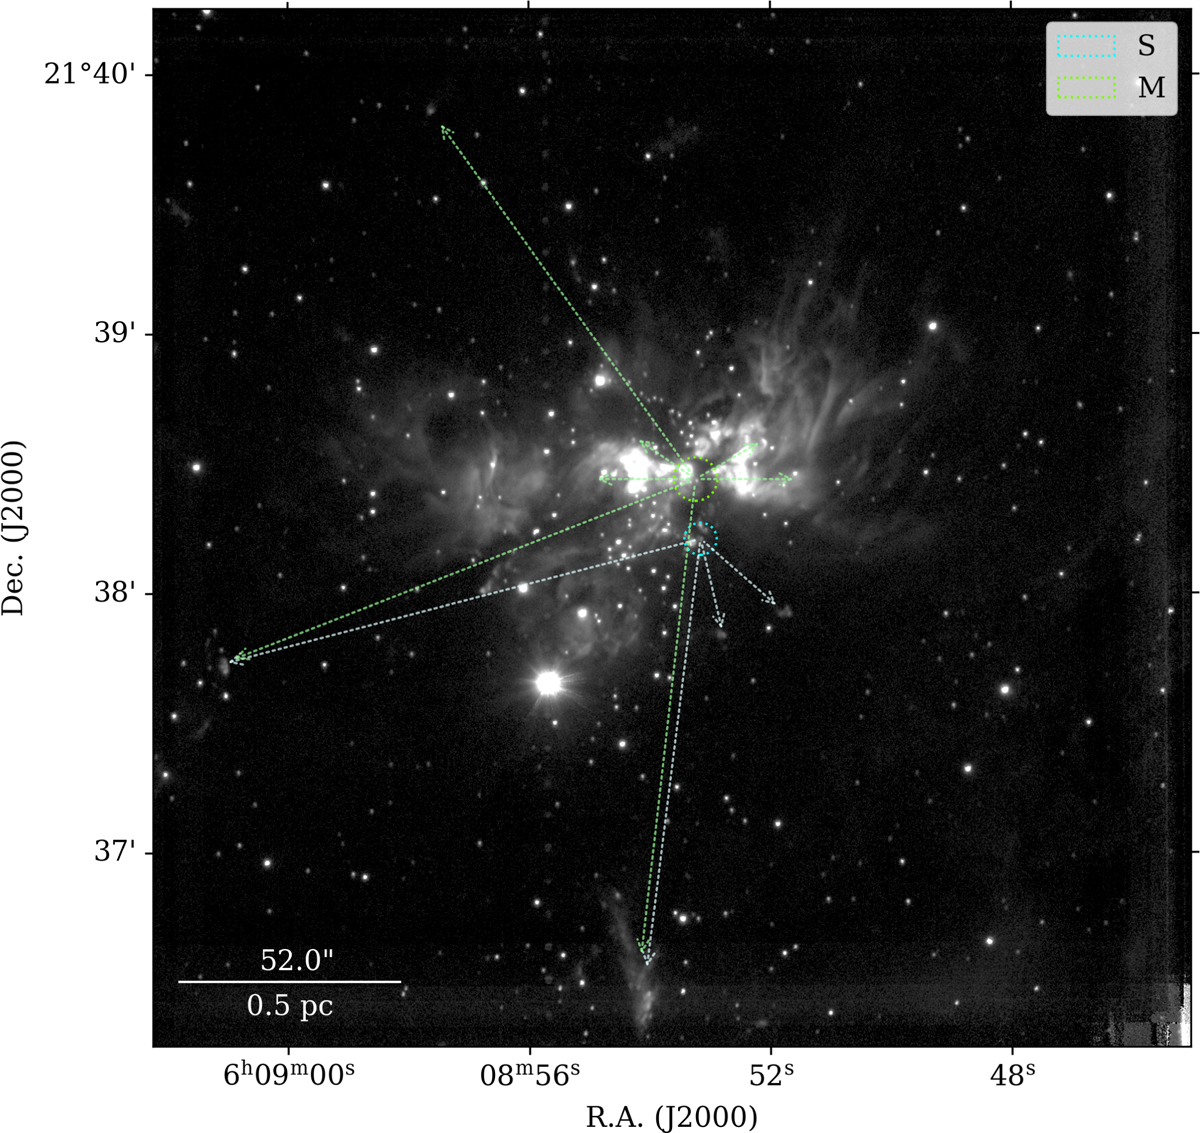
Diagram demonstrating the attribution of knots to potential driving sources or clusters (see Sect. 3.3.2). AFGL 5180 M and S and their potentially associated jets are shown as the circles and arrows in green and blue, respectively.
Current usage metrics show cumulative count of Article Views (full-text article views including HTML views, PDF and ePub downloads, according to the available data) and Abstracts Views on Vision4Press platform.
Data correspond to usage on the plateform after 2015. The current usage metrics is available 48-96 hours after online publication and is updated daily on week days.
Initial download of the metrics may take a while.