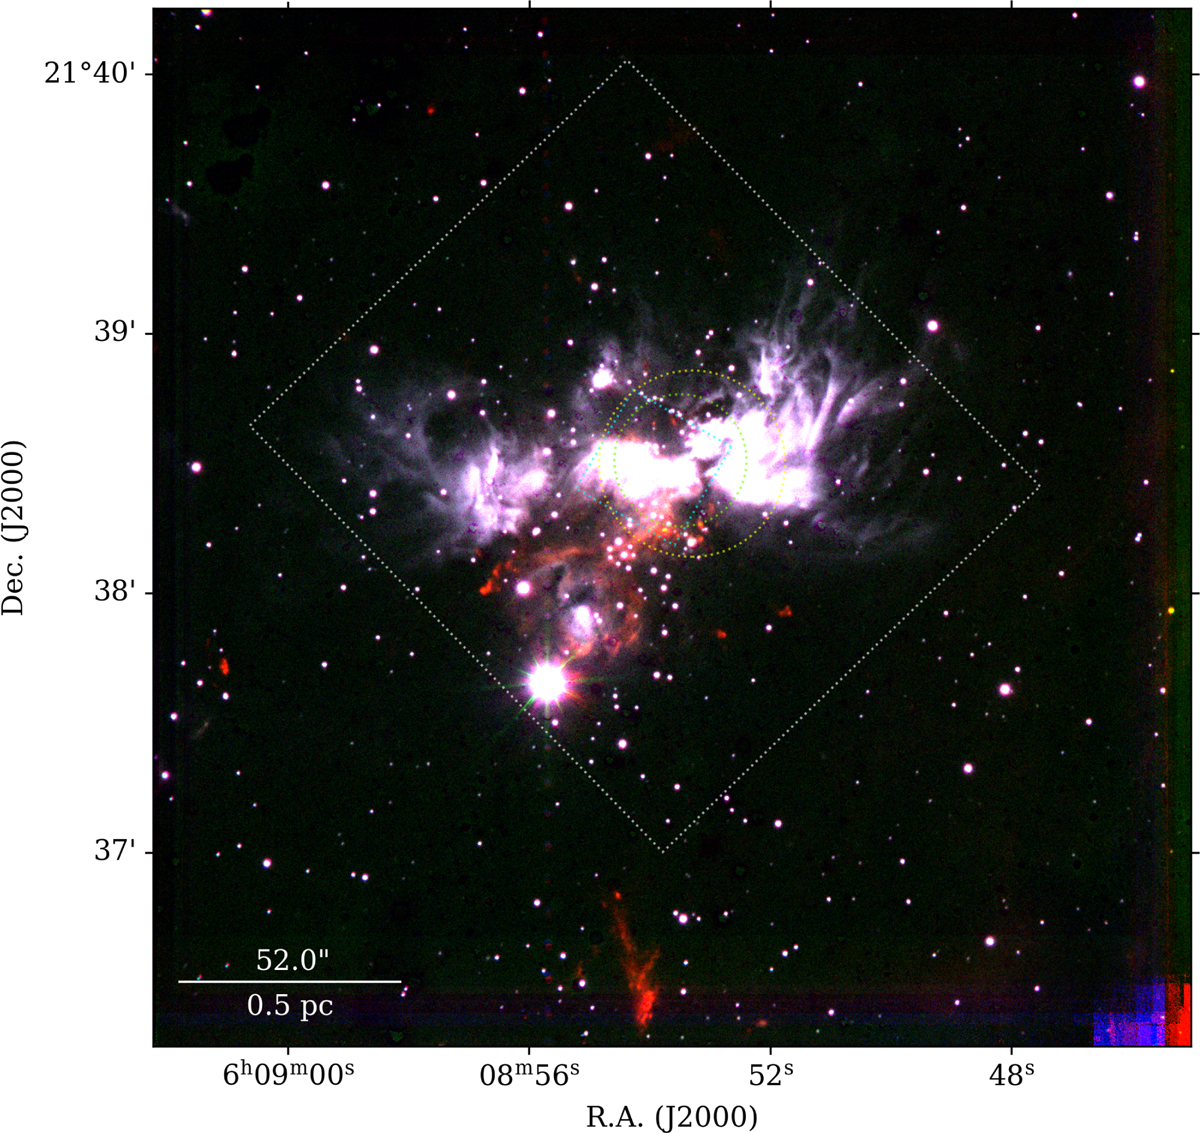
Fig. 1
Download original image
RGB image of the LBT LUCI seeing-limited data. H2 emission is shown in red, K-band in green, and Brγ in blue. The FOV of the LUCI-1 SOUL AO observations (Fig. 2) is indicated by the dotted cyan box, and the FOV of the HST observations (Fig. 3) is represented by the dotted white box. The FOV of the ALMA Bands 6 and 7 observations are indicated by the yellow and green circles, respectively.
Current usage metrics show cumulative count of Article Views (full-text article views including HTML views, PDF and ePub downloads, according to the available data) and Abstracts Views on Vision4Press platform.
Data correspond to usage on the plateform after 2015. The current usage metrics is available 48-96 hours after online publication and is updated daily on week days.
Initial download of the metrics may take a while.