Fig. 9
Download original image
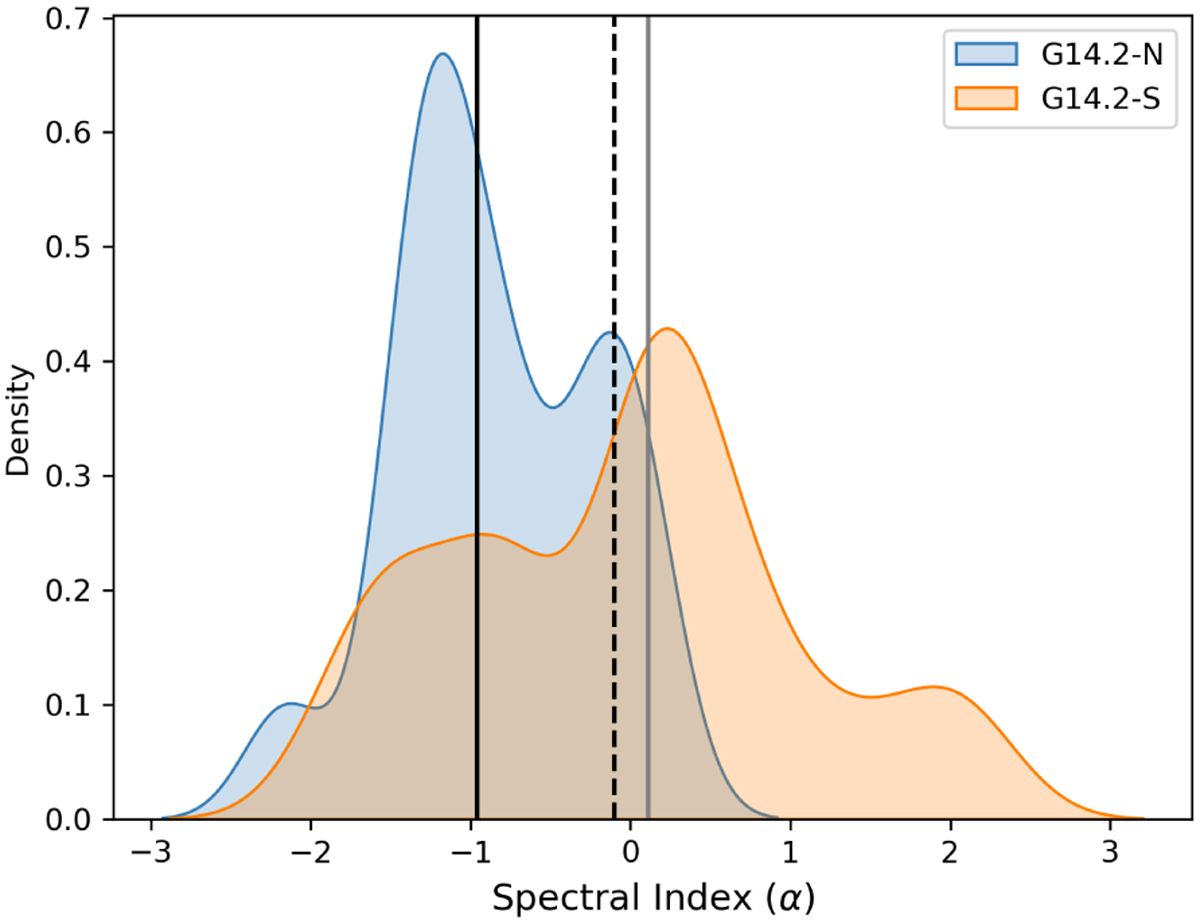
Kernel density estimation (KDE) showing the probability distribution of the spectral index for the sources detected in G14.2 for which it has been possible to determine the origin of the radio continuum emission. The black dashed line at α = −0.1 draws the boundary between thermal emission and nonthermal emission. Solid lines show the median value of the spectral index for G14.2-N (black) and G14.2-S (gray).
Current usage metrics show cumulative count of Article Views (full-text article views including HTML views, PDF and ePub downloads, according to the available data) and Abstracts Views on Vision4Press platform.
Data correspond to usage on the plateform after 2015. The current usage metrics is available 48-96 hours after online publication and is updated daily on week days.
Initial download of the metrics may take a while.