Open Access
Fig. 6
Download original image
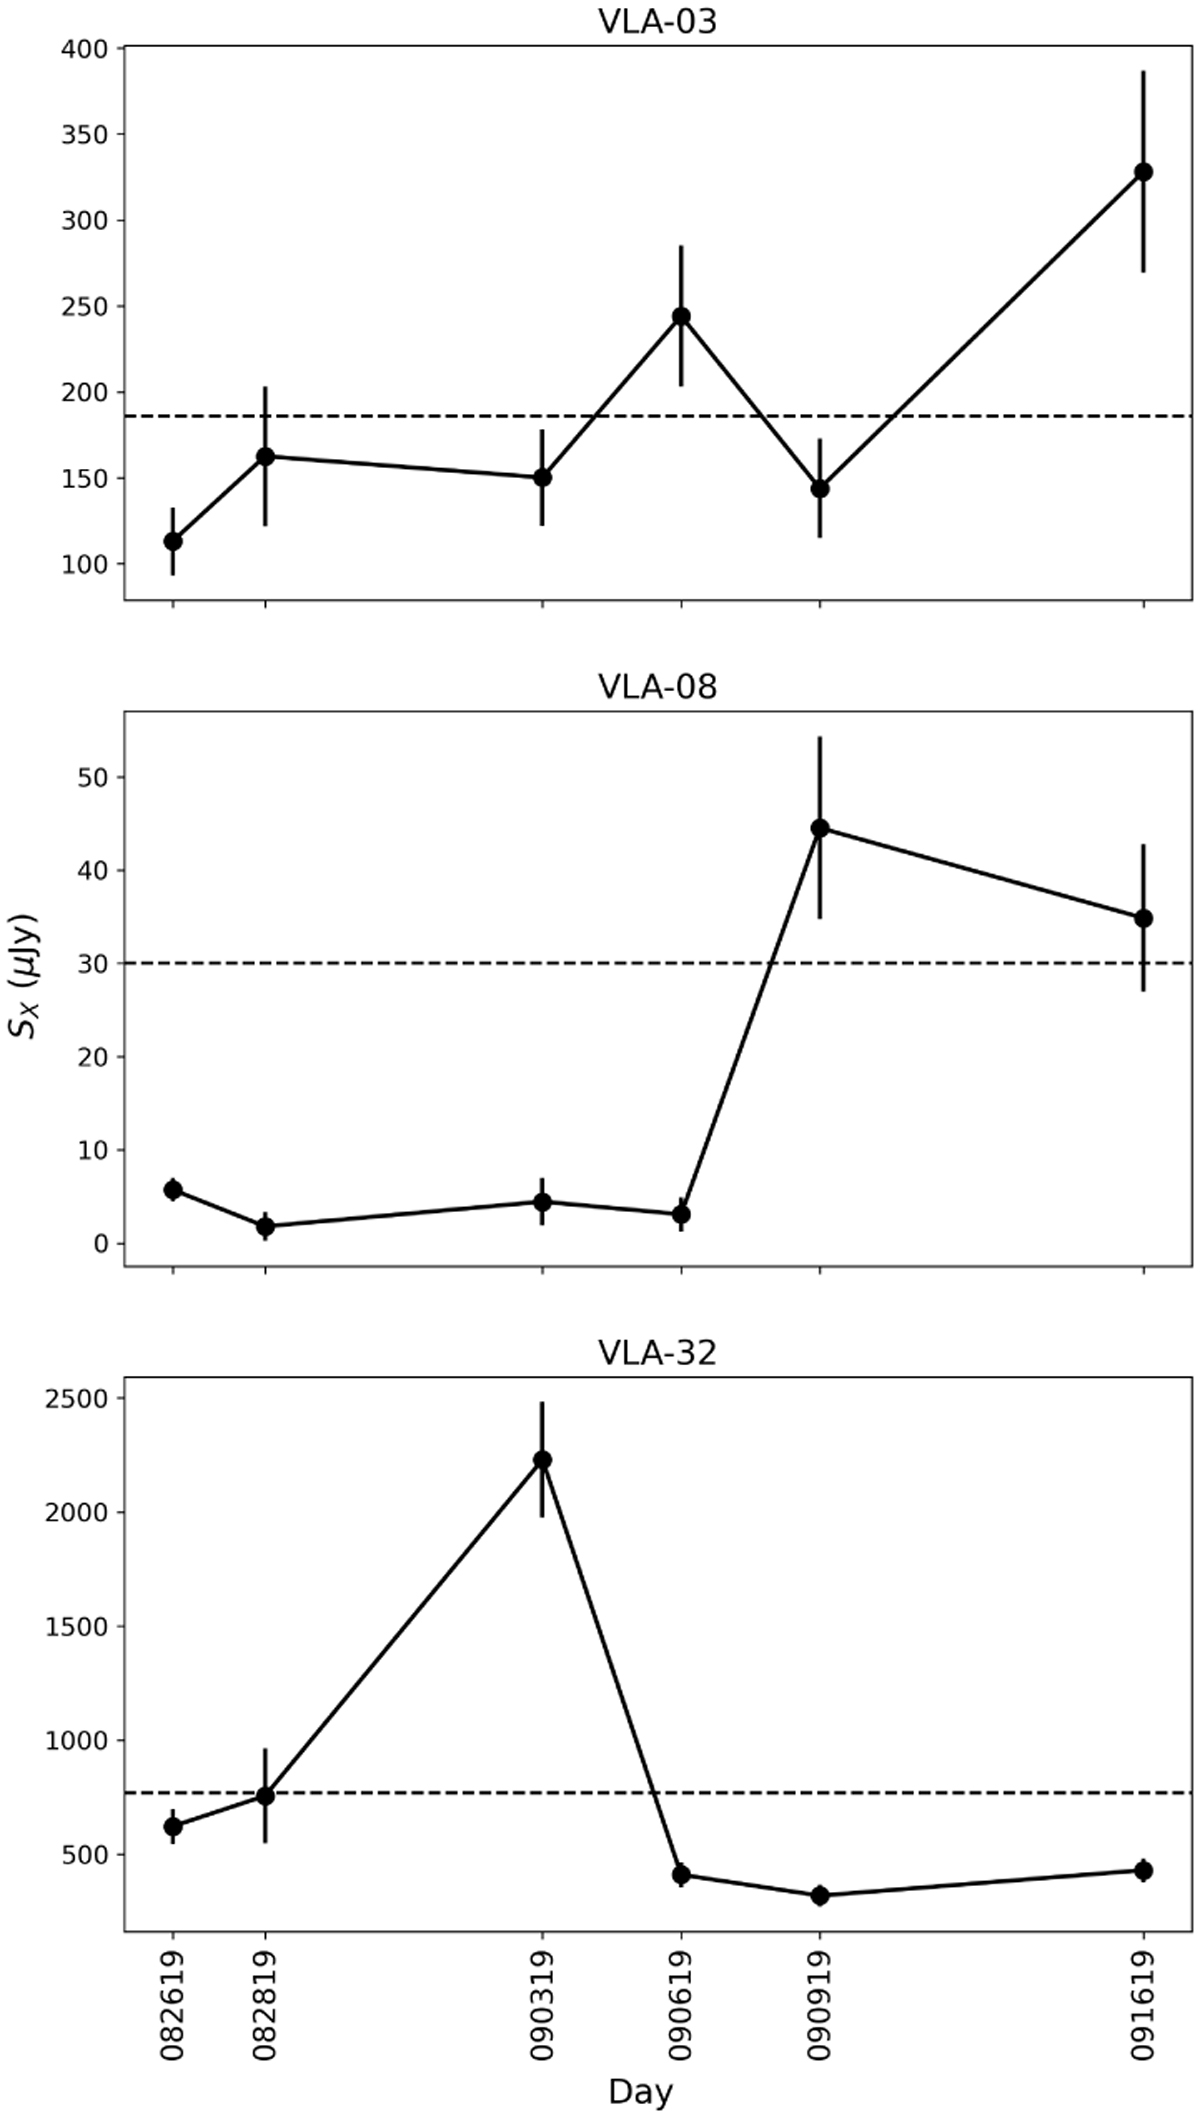
Integrated flux of the variable sources detected in G14.2-N at X-band during the observed days. The sources were observed during 2019 August 26,28, and September 3, 6, 9 and 16. The black dashed line corresponds to the established cutoff for each source shown in Table 5.
Current usage metrics show cumulative count of Article Views (full-text article views including HTML views, PDF and ePub downloads, according to the available data) and Abstracts Views on Vision4Press platform.
Data correspond to usage on the plateform after 2015. The current usage metrics is available 48-96 hours after online publication and is updated daily on week days.
Initial download of the metrics may take a while.