Fig. 4
Download original image
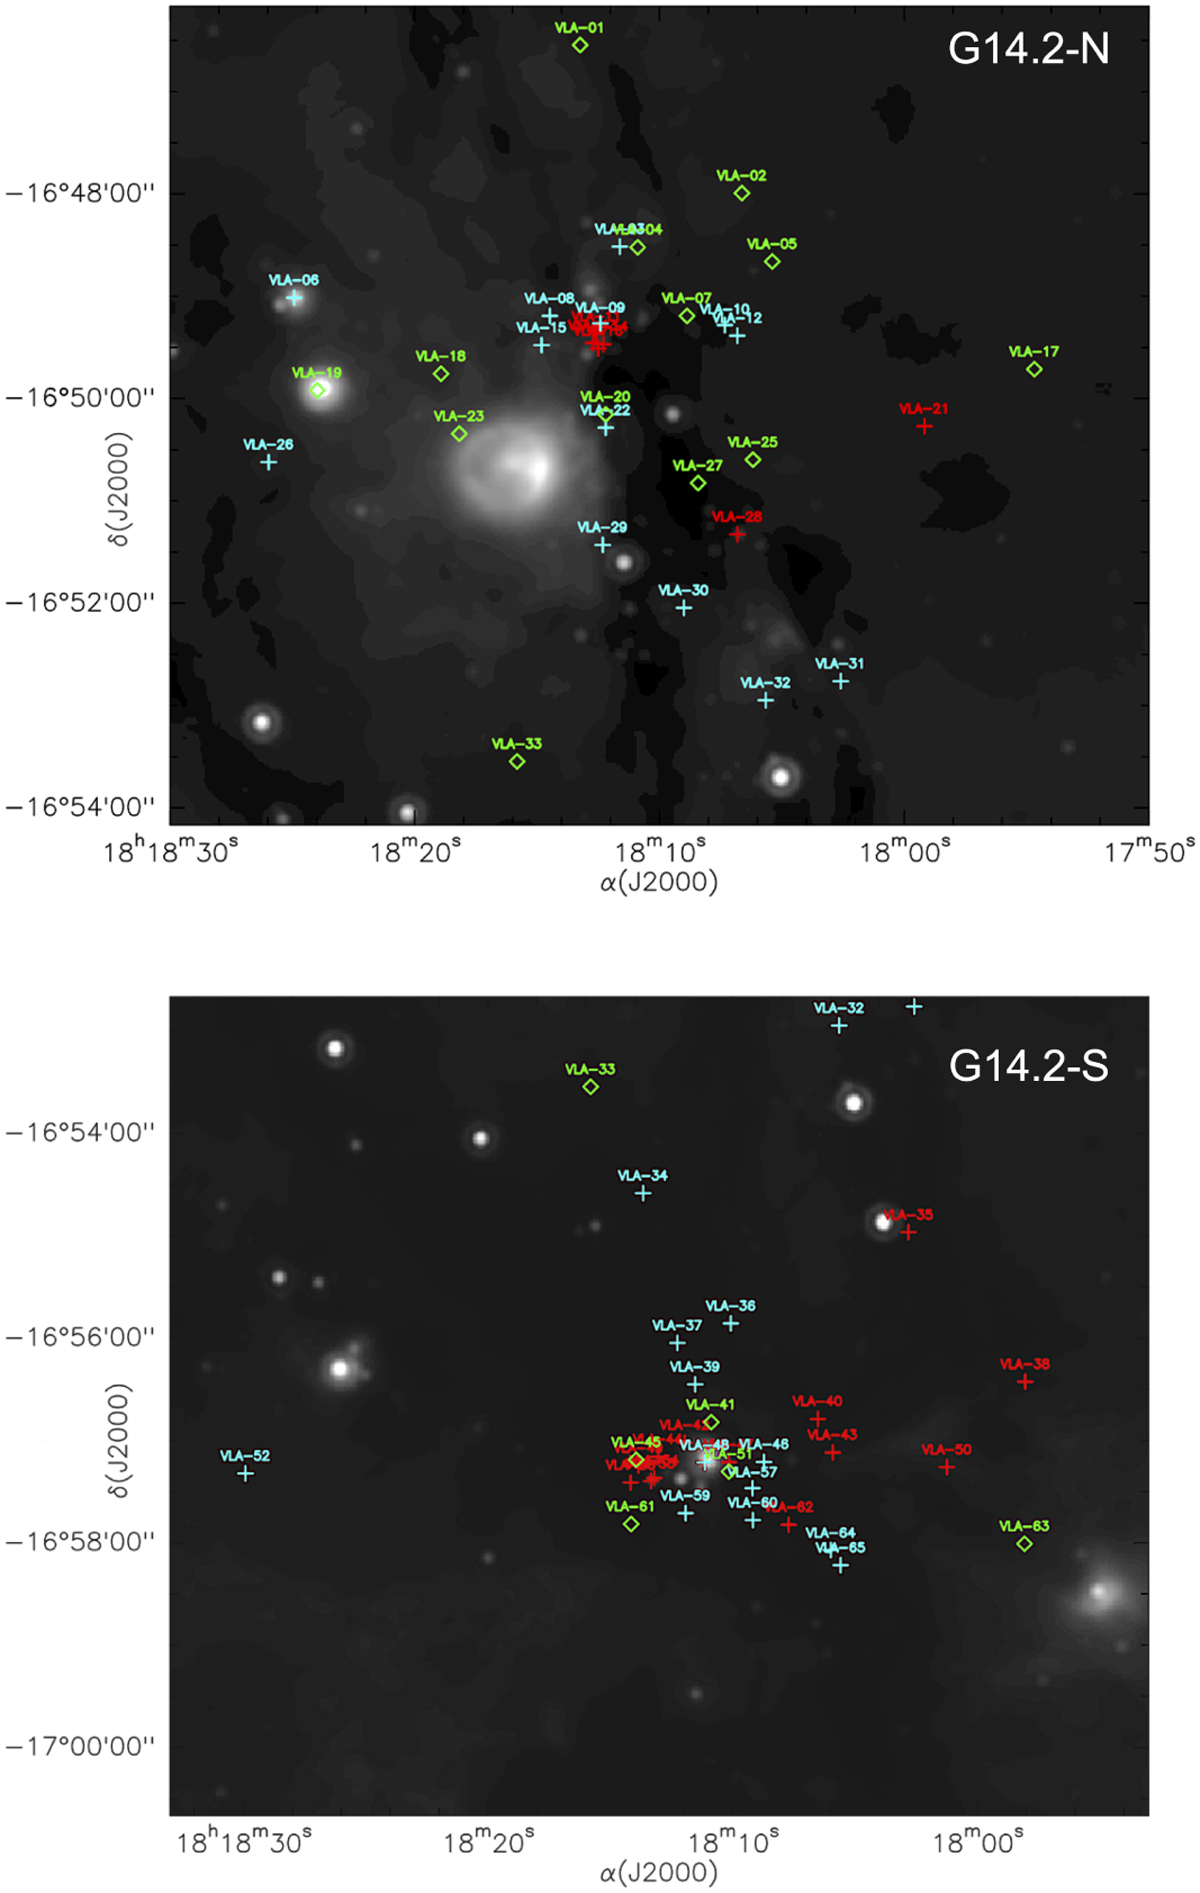
MIPSGAL image (Carey et al. 2009) at 24 µm overlaid on the centimeter sources detected in this work in G14.2-N (top panel) and G14.2-S (bottom panel). Red crosses depict radio sources with an IR counterpart (Povich et al. 2016). Cyan crosses depict radio sources with an X-ray and IR counterpart (Povich et al. 2016). Green diamonds depict radio sources with no IR or X-ray counterpart.
Current usage metrics show cumulative count of Article Views (full-text article views including HTML views, PDF and ePub downloads, according to the available data) and Abstracts Views on Vision4Press platform.
Data correspond to usage on the plateform after 2015. The current usage metrics is available 48-96 hours after online publication and is updated daily on week days.
Initial download of the metrics may take a while.