Fig. 3
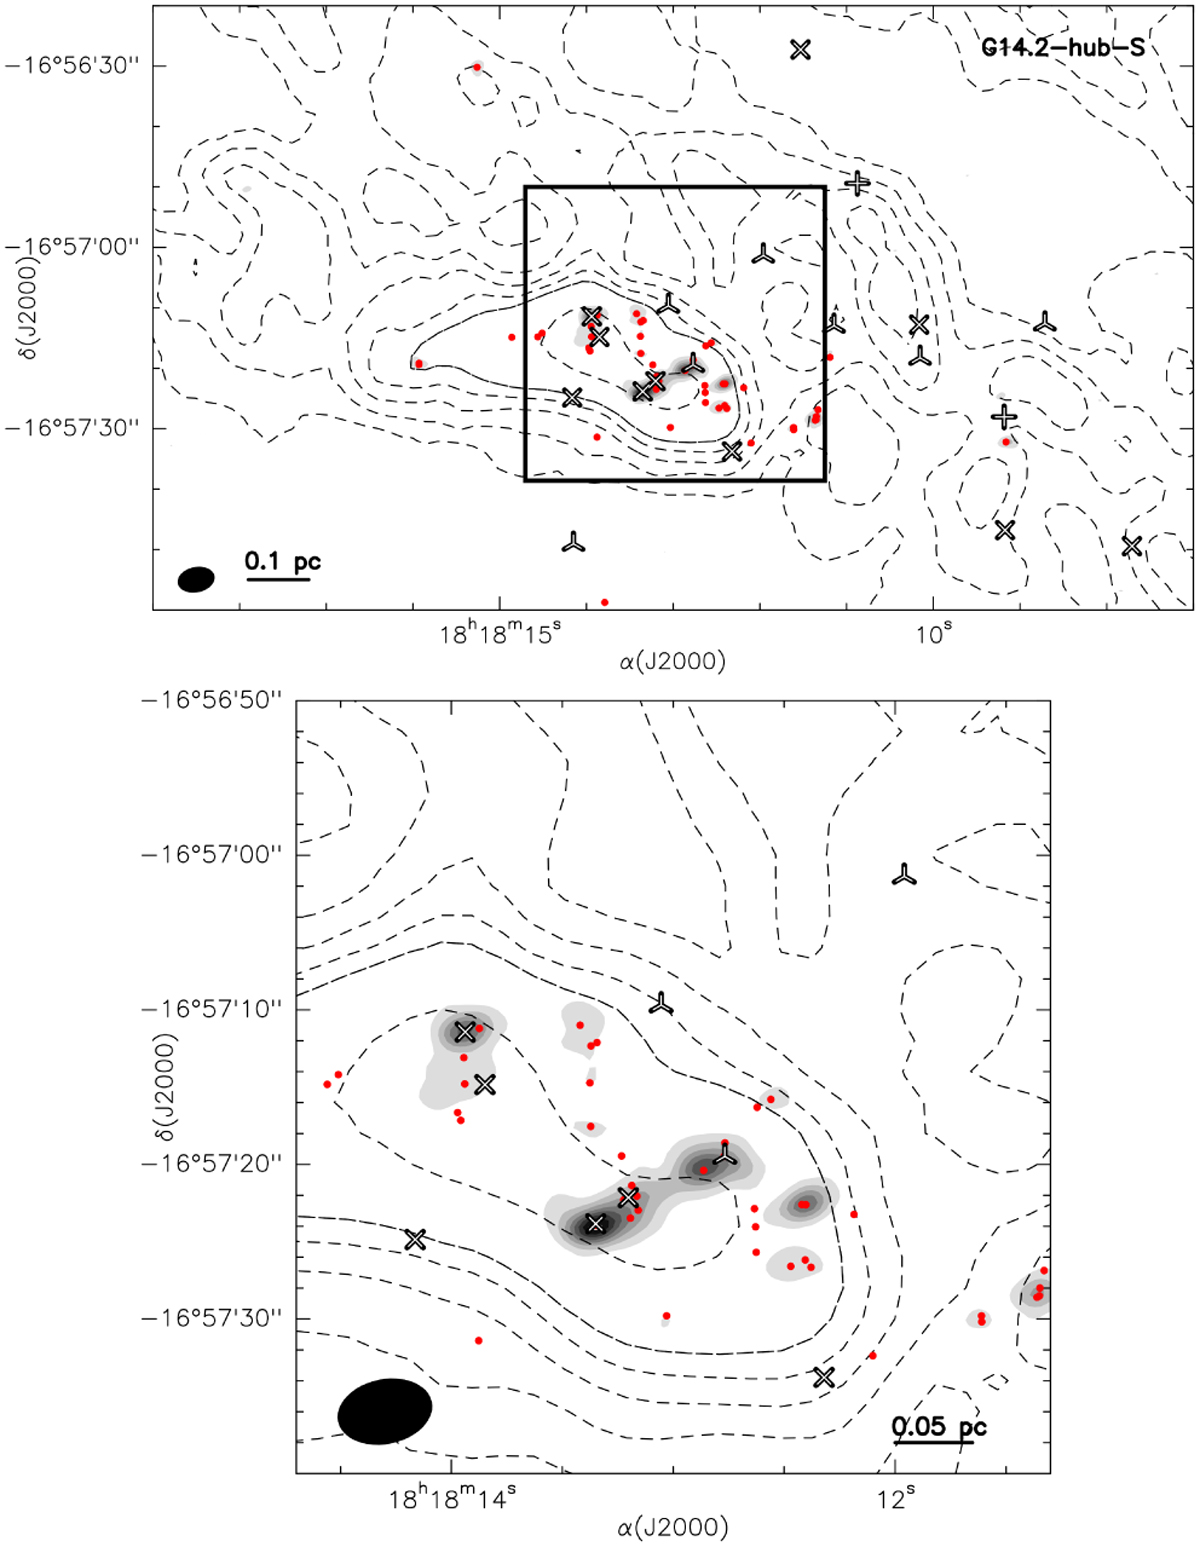
Download original image
ALMA image (gray) at 3 mm (Ohashi et al. 2016) of G14.2-hub-S overlaid on the NH3 (1,1) integrated intensity (black dashed contours) from Busquet et al. (2013). The top panel corresponds to the gray rectangle marked in Fig. 1 while the bottom panel shows a close-up of the central region around G14.2-hub-N. In both panels contour levels of the grayscale image start at 3σ and increase in steps of 6σ, where σ is the RMS of the map (0.2 mJy beam−1). Red dots depict the dust continuum sources detected with ALMA at 1.3 mm (Zhang et al., priv. comm.). The synthesized beam is shown in the bottom left corner of both images. Symbols are the same as in Fig. 1.
Current usage metrics show cumulative count of Article Views (full-text article views including HTML views, PDF and ePub downloads, according to the available data) and Abstracts Views on Vision4Press platform.
Data correspond to usage on the plateform after 2015. The current usage metrics is available 48-96 hours after online publication and is updated daily on week days.
Initial download of the metrics may take a while.