Open Access
Fig. E.1
Download original image
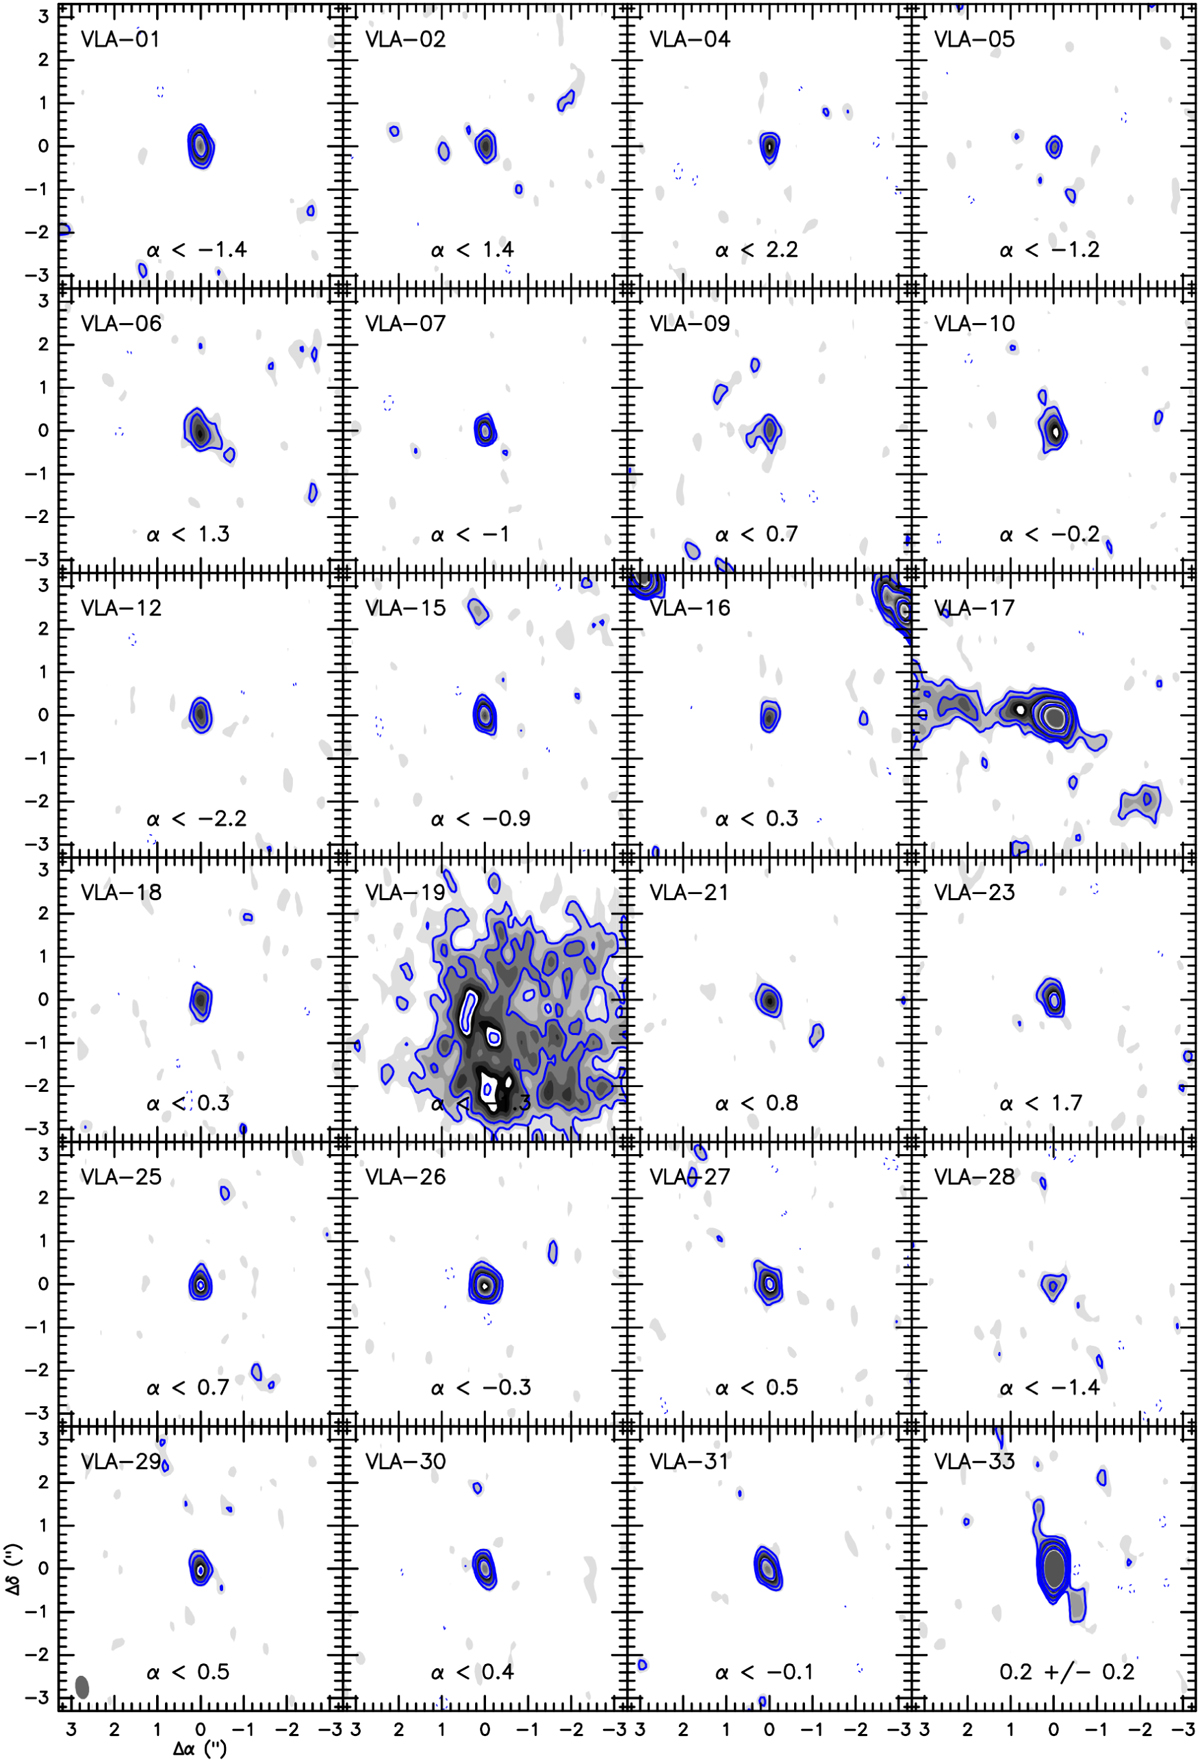
VLA continuum images at C-band (blue contours and gray image) of the sources detected in G14.2-N only at the C-band. Contour levels are ±5, ±3, 10, and 20 times the RMS of the maps (2.2 µJy beam−1). The synthesized beam of the C-band is shown in the bottom-left corner of the bottom-left panel.
Current usage metrics show cumulative count of Article Views (full-text article views including HTML views, PDF and ePub downloads, according to the available data) and Abstracts Views on Vision4Press platform.
Data correspond to usage on the plateform after 2015. The current usage metrics is available 48-96 hours after online publication and is updated daily on week days.
Initial download of the metrics may take a while.