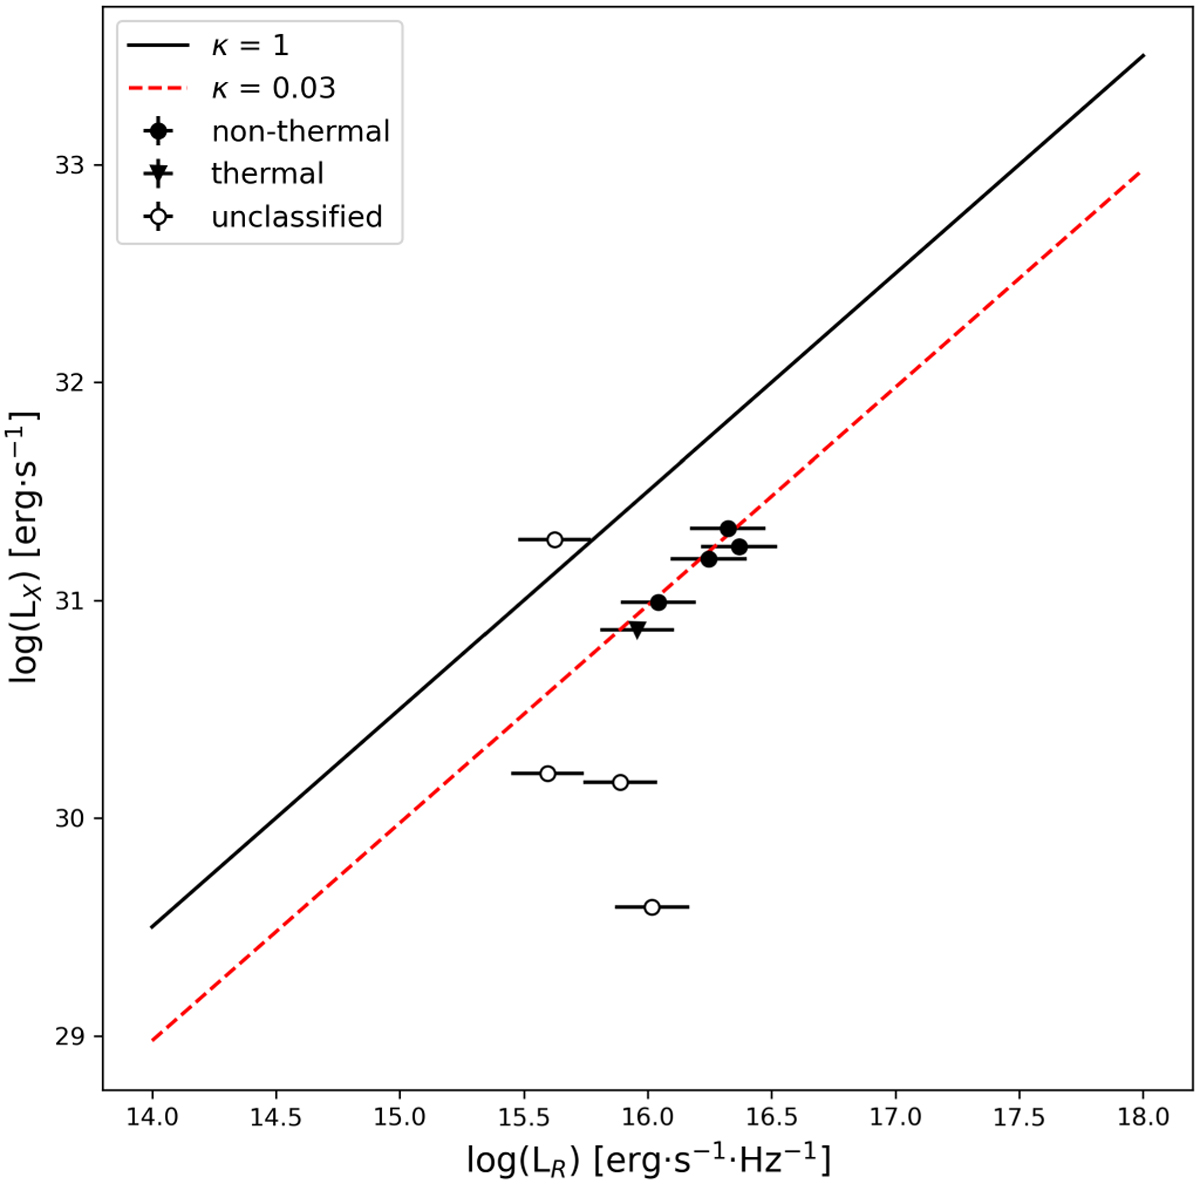
Fig. 12
Download original image
X-ray luminosity as a function of radio luminosity for the sources in G14.2 with a measured X-ray luminosity (Povich et al. 2016). The black line corresponds to the Güdel-Benz relation with κ = 1. The red dashed line corresponds to the Güdel-Benz relation but with κ = 0.03. Black dots depict nonthermal sources, black triangles represent the thermal sources, and unfilled black dots represent the radio sources with an unclassified origin of radio continuum emission. Variable sources have been excluded for this representation.
Current usage metrics show cumulative count of Article Views (full-text article views including HTML views, PDF and ePub downloads, according to the available data) and Abstracts Views on Vision4Press platform.
Data correspond to usage on the plateform after 2015. The current usage metrics is available 48-96 hours after online publication and is updated daily on week days.
Initial download of the metrics may take a while.