Fig. 10
Download original image
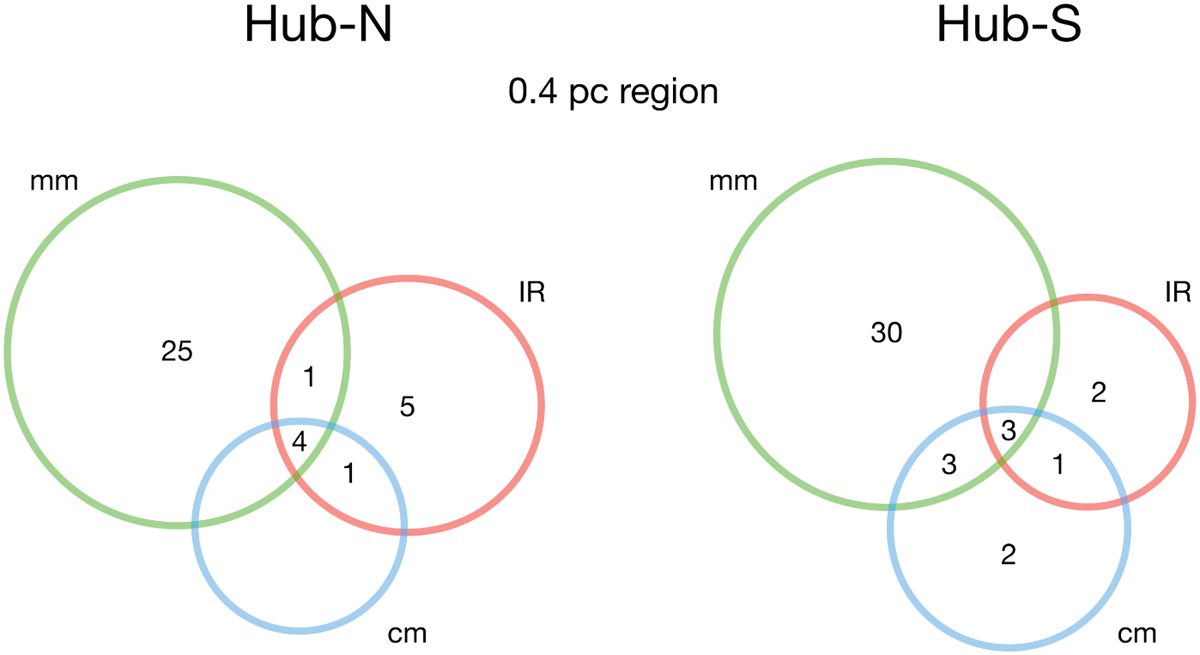
Schematic representation of the sources detected in the 0.4 pc region around each hub and their counterparts at different wavelengths. Millimeter sources correspond to the ones detected in Busquet et al. (2016), Ohashi et al. (2016) and Zhang et al. (priv. comm.). Infrared sources correspond to those detected in Povich et al. (2016). Centimeter sources correspond to those detected in this work.
Current usage metrics show cumulative count of Article Views (full-text article views including HTML views, PDF and ePub downloads, according to the available data) and Abstracts Views on Vision4Press platform.
Data correspond to usage on the plateform after 2015. The current usage metrics is available 48-96 hours after online publication and is updated daily on week days.
Initial download of the metrics may take a while.