Fig. 2
Download original image
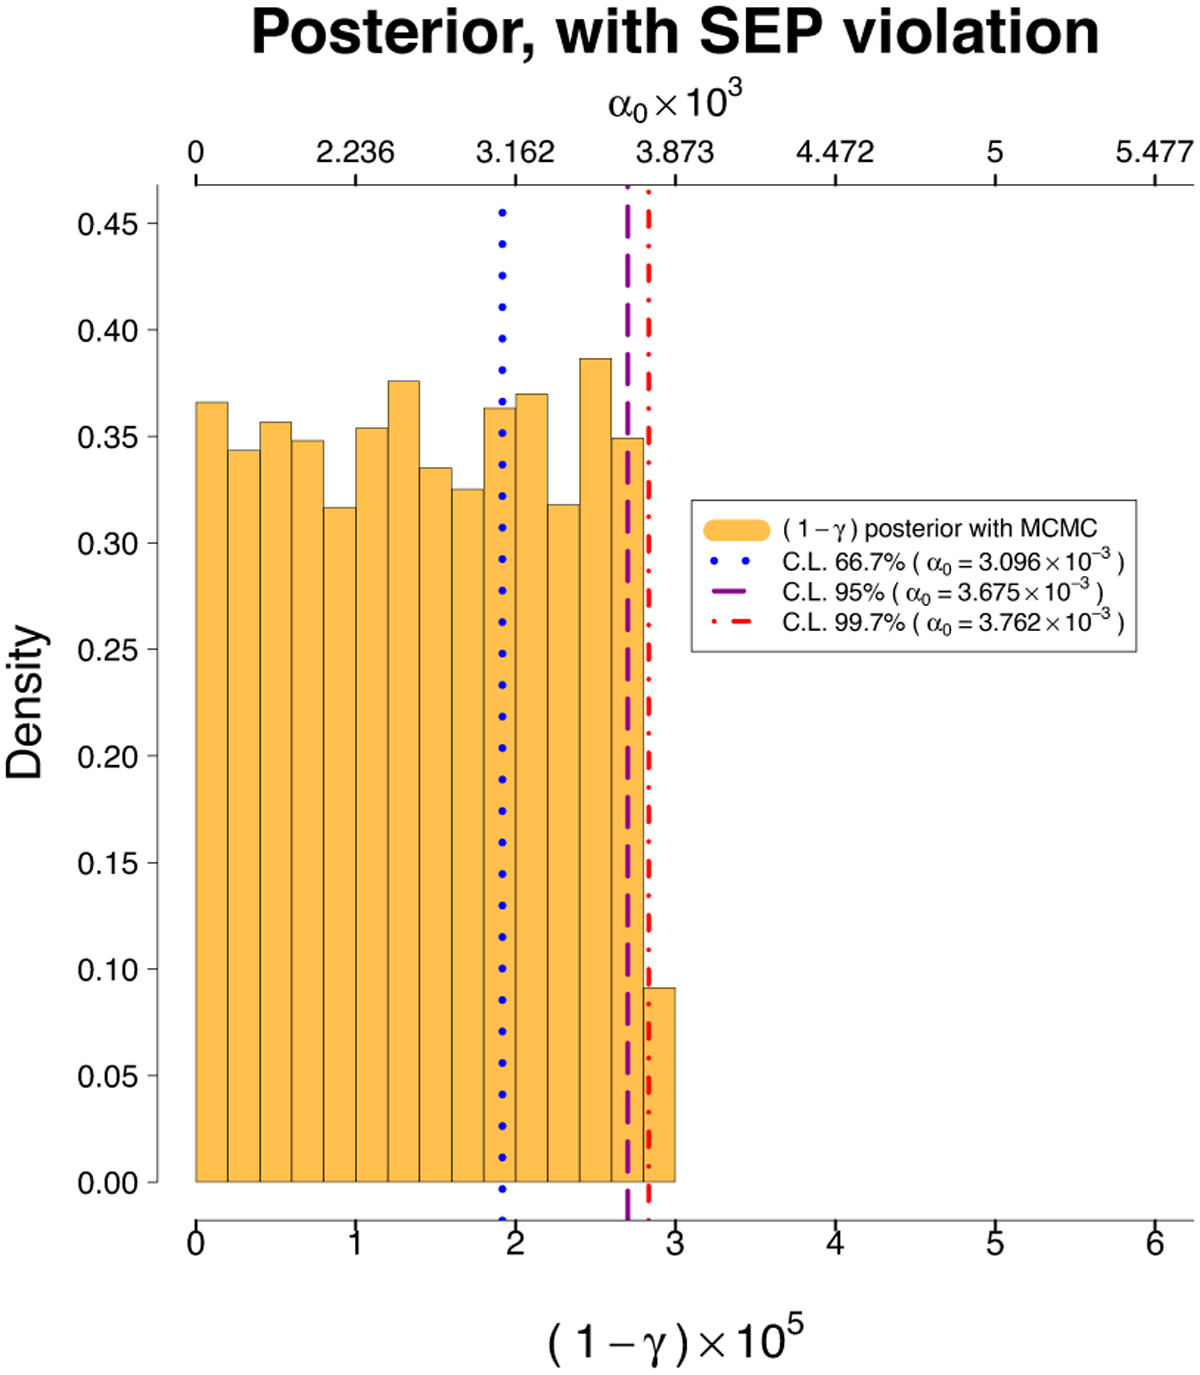
Posterior distribution for 1 − γ and the corresponding values of α0 in the Brans–Dicke framework with the implementation of the SEP violation. Red line (dot-dashed): 99.7% C.L. ((1 − γ) = 2.83 × 10⁻⁵ and α0 = 3.762 × 10⁻³). Blue line (dotted): 66.7% C.L. ((1 − γ) = 1.92 × 10⁻⁵ and α0 = 3.096 × 10⁻³). Purple line (dashed): 95% C.L. ((1 − γ) = 2.70 × 10⁻⁵ and α0 = 3.675 × 10⁻³). The prior for (1 − γ) is a uniform prior between 0 and 15 × 10−5.
Current usage metrics show cumulative count of Article Views (full-text article views including HTML views, PDF and ePub downloads, according to the available data) and Abstracts Views on Vision4Press platform.
Data correspond to usage on the plateform after 2015. The current usage metrics is available 48-96 hours after online publication and is updated daily on week days.
Initial download of the metrics may take a while.