Fig. 7
Download original image
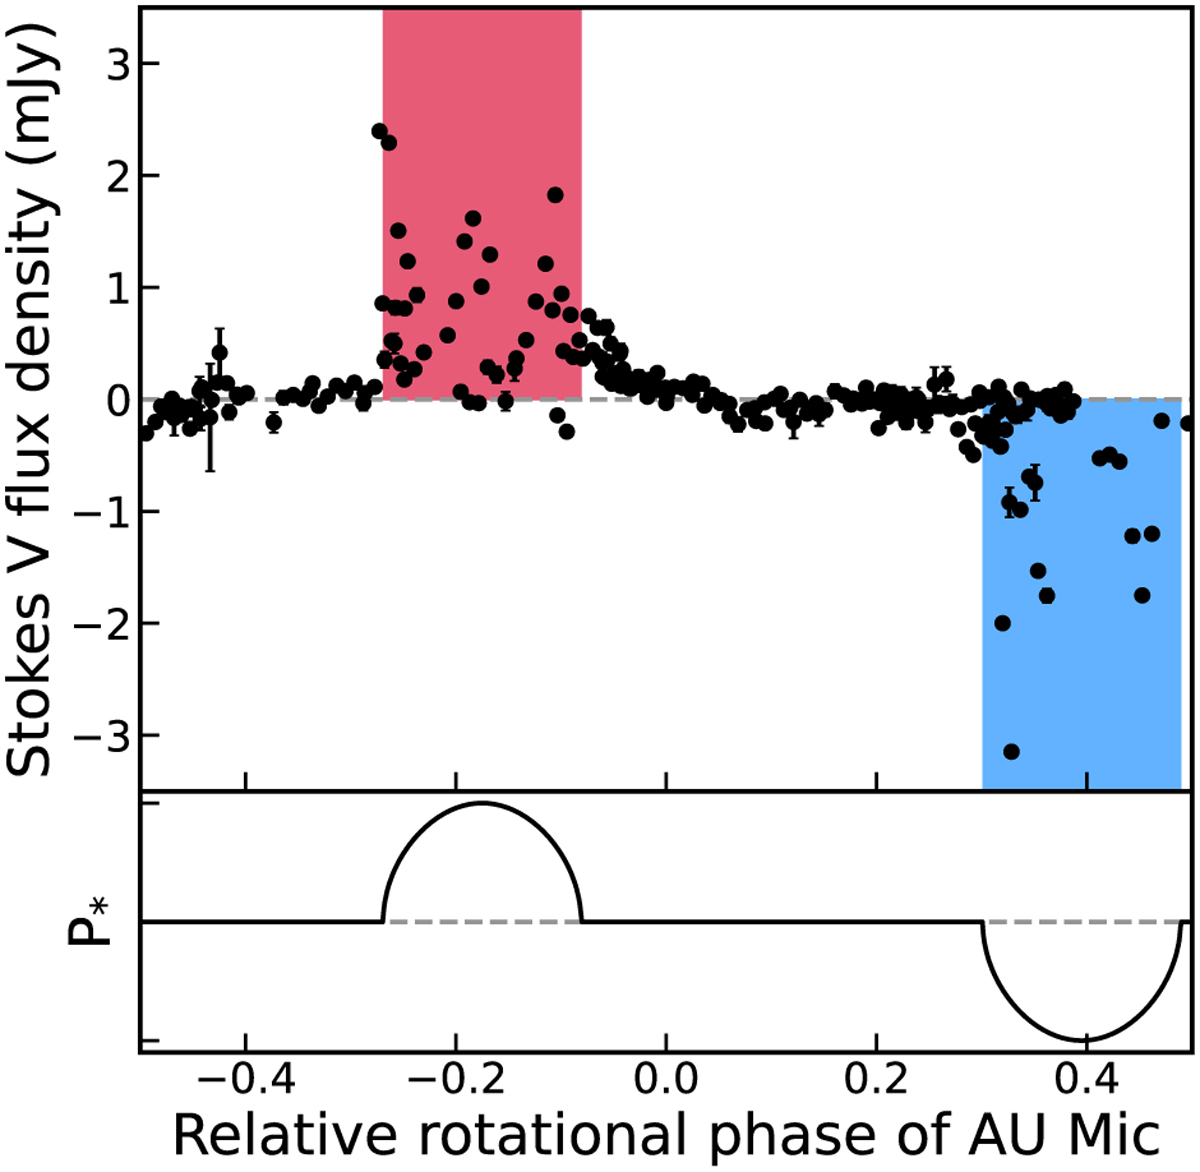
Comparison of the Stokes V light curve to an auroral ring model. The top plot shows the Stokes V light curve including all radio data, phase folded to the rotation period of AU Mic of 4.86 days. The data points represent the flux density averaged over the entire bandwidth in 1-h time bins. The two shaded regions show the two periods of burst visibility, where the red region shows when positive bursts can be produced and the blue region shows the same for negative bursts. The bottom plot shows a model of the visibility of the auroral rings, where P* represents the visibility of the auroral ring, akin to the probability of detecting a burst, multiplied by the predicted sign of emission.
Current usage metrics show cumulative count of Article Views (full-text article views including HTML views, PDF and ePub downloads, according to the available data) and Abstracts Views on Vision4Press platform.
Data correspond to usage on the plateform after 2015. The current usage metrics is available 48-96 hours after online publication and is updated daily on week days.
Initial download of the metrics may take a while.