Fig. 3
Download original image
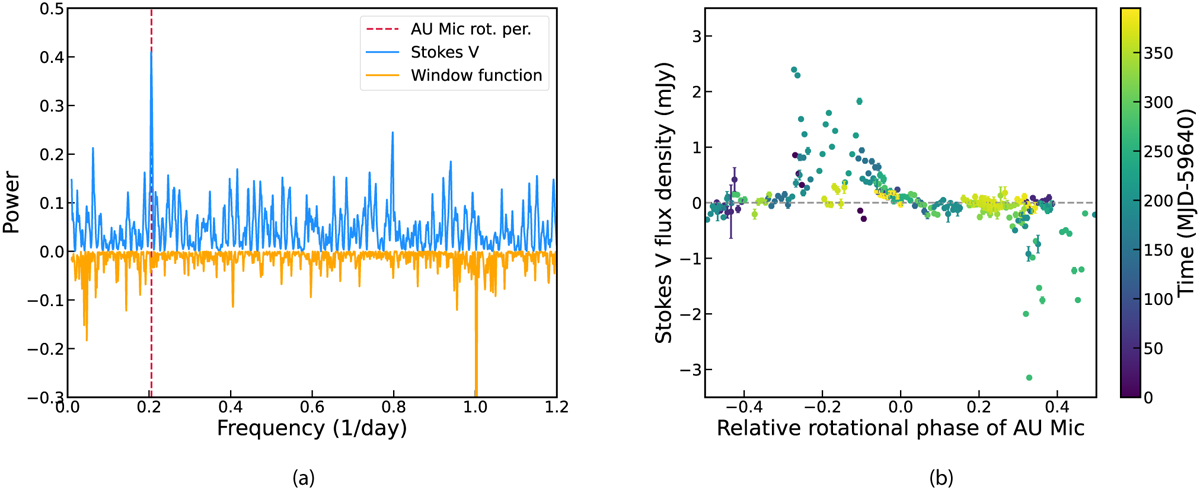
Results of the periodicity analysis on the Stokes V light curve. Panel a: Lomb-Scargle periodogram of our Stokes V light curve, as shown in blue. The red line marks the rotation period of AU Mic (Plavchan et al. 2020). There are no strong peaks associated with the periods of the planets. The orange line communicates the Lomb-Scargle periodogram of the window function, scaled to be readable. Panel b: Stokes V light curve including all radio data, phase folded to the rotation period of AU Mic of 4.86 days. The data points represent the flux density averaged over the entire bandwidth in 1-h time bins. The colour scale represents the time of observing. The zero point is arbitrary, set to the last observation in our campaign at MJD 60035.1.
Current usage metrics show cumulative count of Article Views (full-text article views including HTML views, PDF and ePub downloads, according to the available data) and Abstracts Views on Vision4Press platform.
Data correspond to usage on the plateform after 2015. The current usage metrics is available 48-96 hours after online publication and is updated daily on week days.
Initial download of the metrics may take a while.