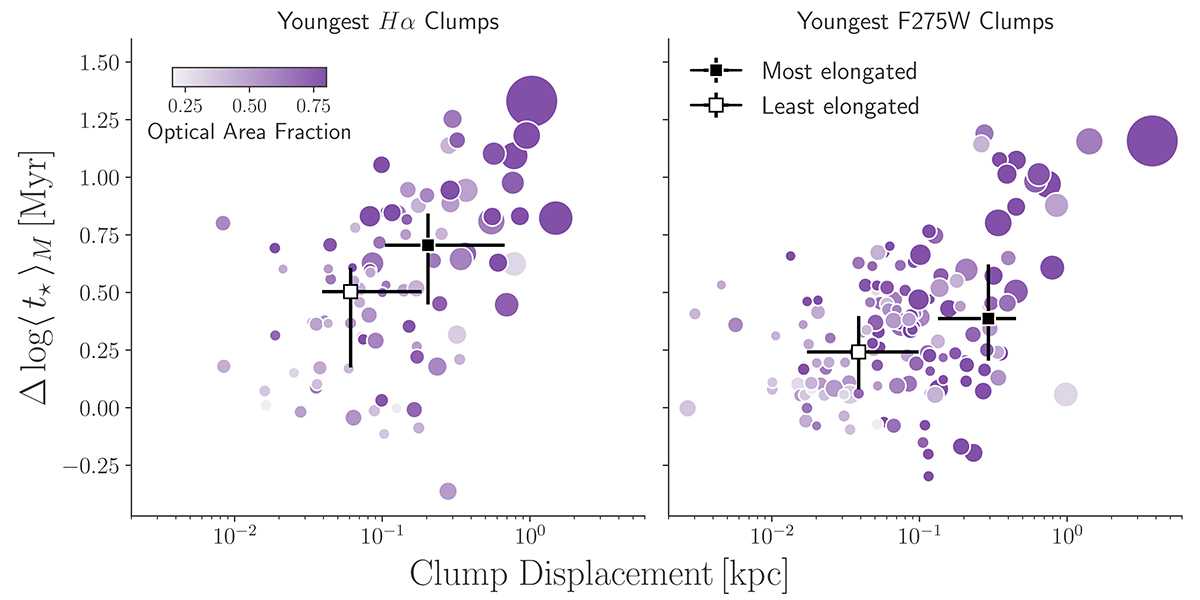
Fig. 9.
Download original image
Clump displacement as a function of the difference between the log ⟨ t⋆ ⟩M of a star-forming complex and the one of the youngest Hα (left) and F275W (right) clump embedded in it. Color indicates the fraction of the star-forming complex that is covered by optical-only emission, and the size of the points is proportional to the radius of the complex. Squares indicate the median position of the 20% most elongated (black) and the 20% least elongated (white) complexes, with error bars showing the interquartile regions of the distributions.
Current usage metrics show cumulative count of Article Views (full-text article views including HTML views, PDF and ePub downloads, according to the available data) and Abstracts Views on Vision4Press platform.
Data correspond to usage on the plateform after 2015. The current usage metrics is available 48-96 hours after online publication and is updated daily on week days.
Initial download of the metrics may take a while.