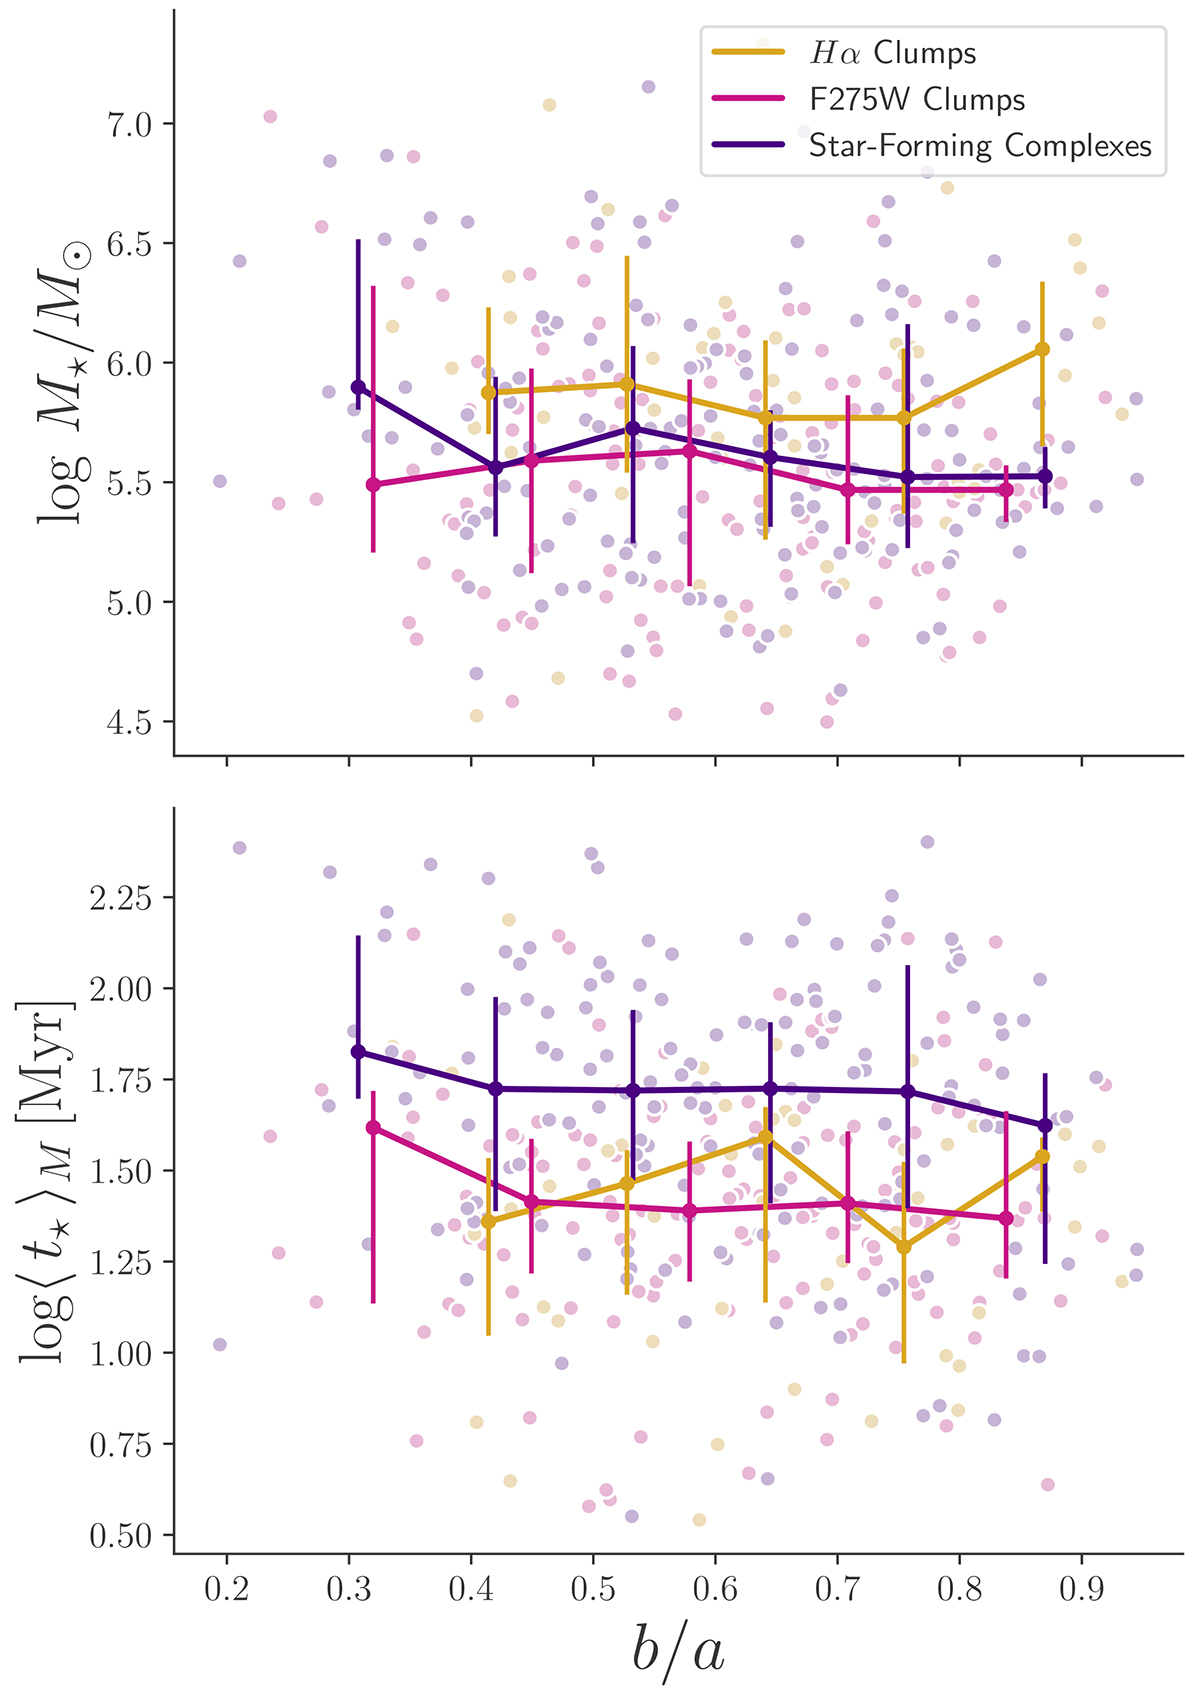
Fig. 8.
Download original image
Axial ratio (b/a) against stellar mass (top) and ⟨ t⋆ ⟩M (bottom) for Hα clumps (gold), F275W clumps (pink), and star-forming complexes (purple). Median lines are color-coded as the points and error bars represent interquartile regions for each b/a bin.
Current usage metrics show cumulative count of Article Views (full-text article views including HTML views, PDF and ePub downloads, according to the available data) and Abstracts Views on Vision4Press platform.
Data correspond to usage on the plateform after 2015. The current usage metrics is available 48-96 hours after online publication and is updated daily on week days.
Initial download of the metrics may take a while.