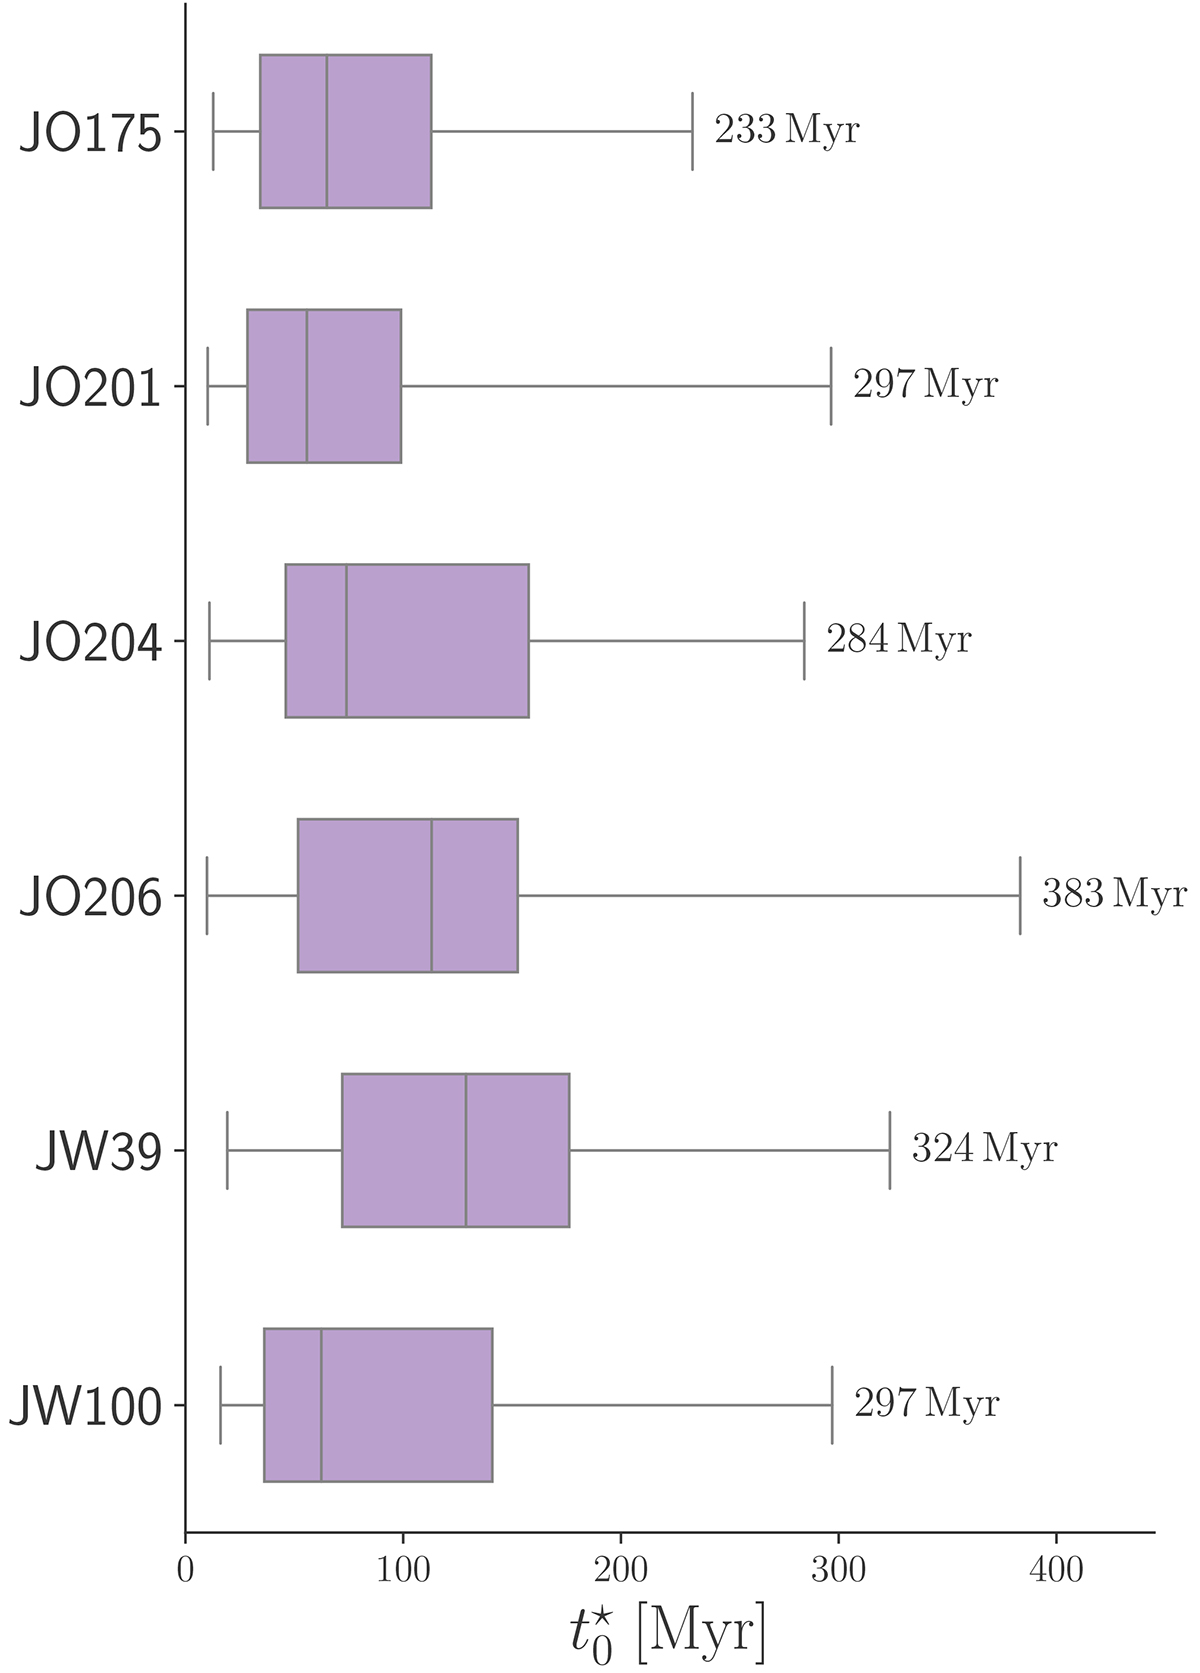
Fig. 7.
Download original image
Box plots tracing the distribution of the age of the oldest stars in star-forming complexes. Boxes span the interquartile regions, horizontal lines in the boxes indicate the median and whiskers mark the 1% and 99% percentiles of the distributions.
Current usage metrics show cumulative count of Article Views (full-text article views including HTML views, PDF and ePub downloads, according to the available data) and Abstracts Views on Vision4Press platform.
Data correspond to usage on the plateform after 2015. The current usage metrics is available 48-96 hours after online publication and is updated daily on week days.
Initial download of the metrics may take a while.