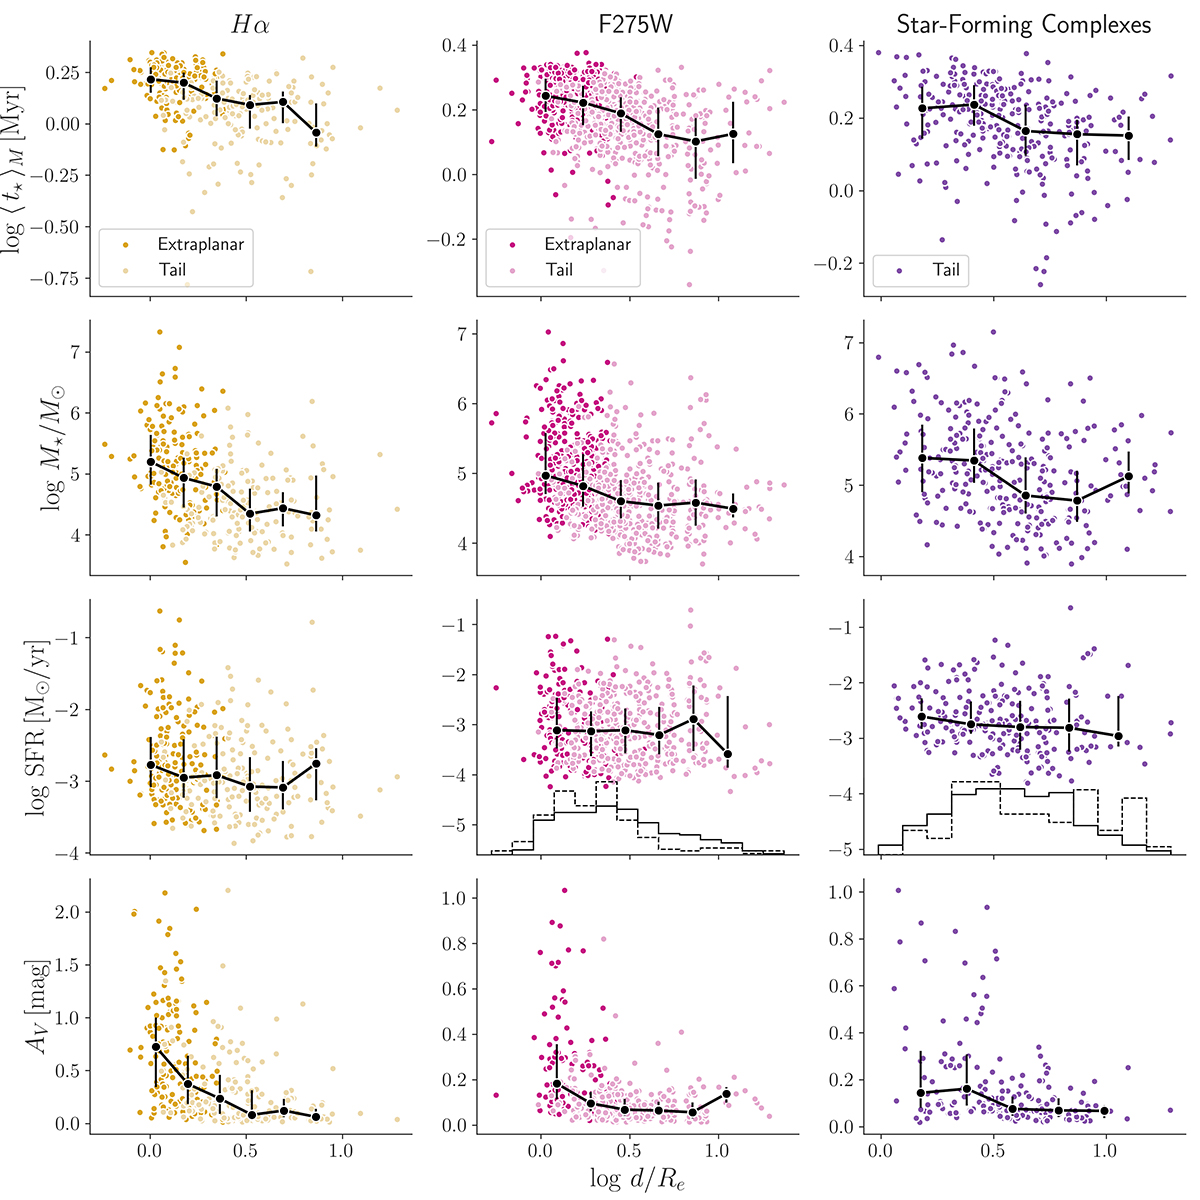
Fig. 6.
Download original image
Trends (or lack thereof) of the measured properties with galactocentric distance. ⟨ t⋆ ⟩M (top), log M⋆ (second row), SFR (third row) and AV (bottom) of clumps and complexes are plotted against the normalized log distance log d/Re to the center of the host galaxy. The different panels show clumps selected from Hα (left) and F275W (middle), as well as star-forming complexes (right). Black points trace the median values of physical properties in bins of log d/Re and vertical lines indicate interquartile regions, points are plotted in the center of each bin. In the third row of panels, only objects within ±1 dex of the sequence shown in Fig. 5 are included as points, histograms show the distribution of objects below (dashed line) and within (solid line) ±1 dex of the sequence. In the bottom row we show only objects that formed a significant fraction of their stellar mass in the past 20 Myr (classified as late decliners in Sect. 3.3).
Current usage metrics show cumulative count of Article Views (full-text article views including HTML views, PDF and ePub downloads, according to the available data) and Abstracts Views on Vision4Press platform.
Data correspond to usage on the plateform after 2015. The current usage metrics is available 48-96 hours after online publication and is updated daily on week days.
Initial download of the metrics may take a while.