Fig. 5.
Download original image
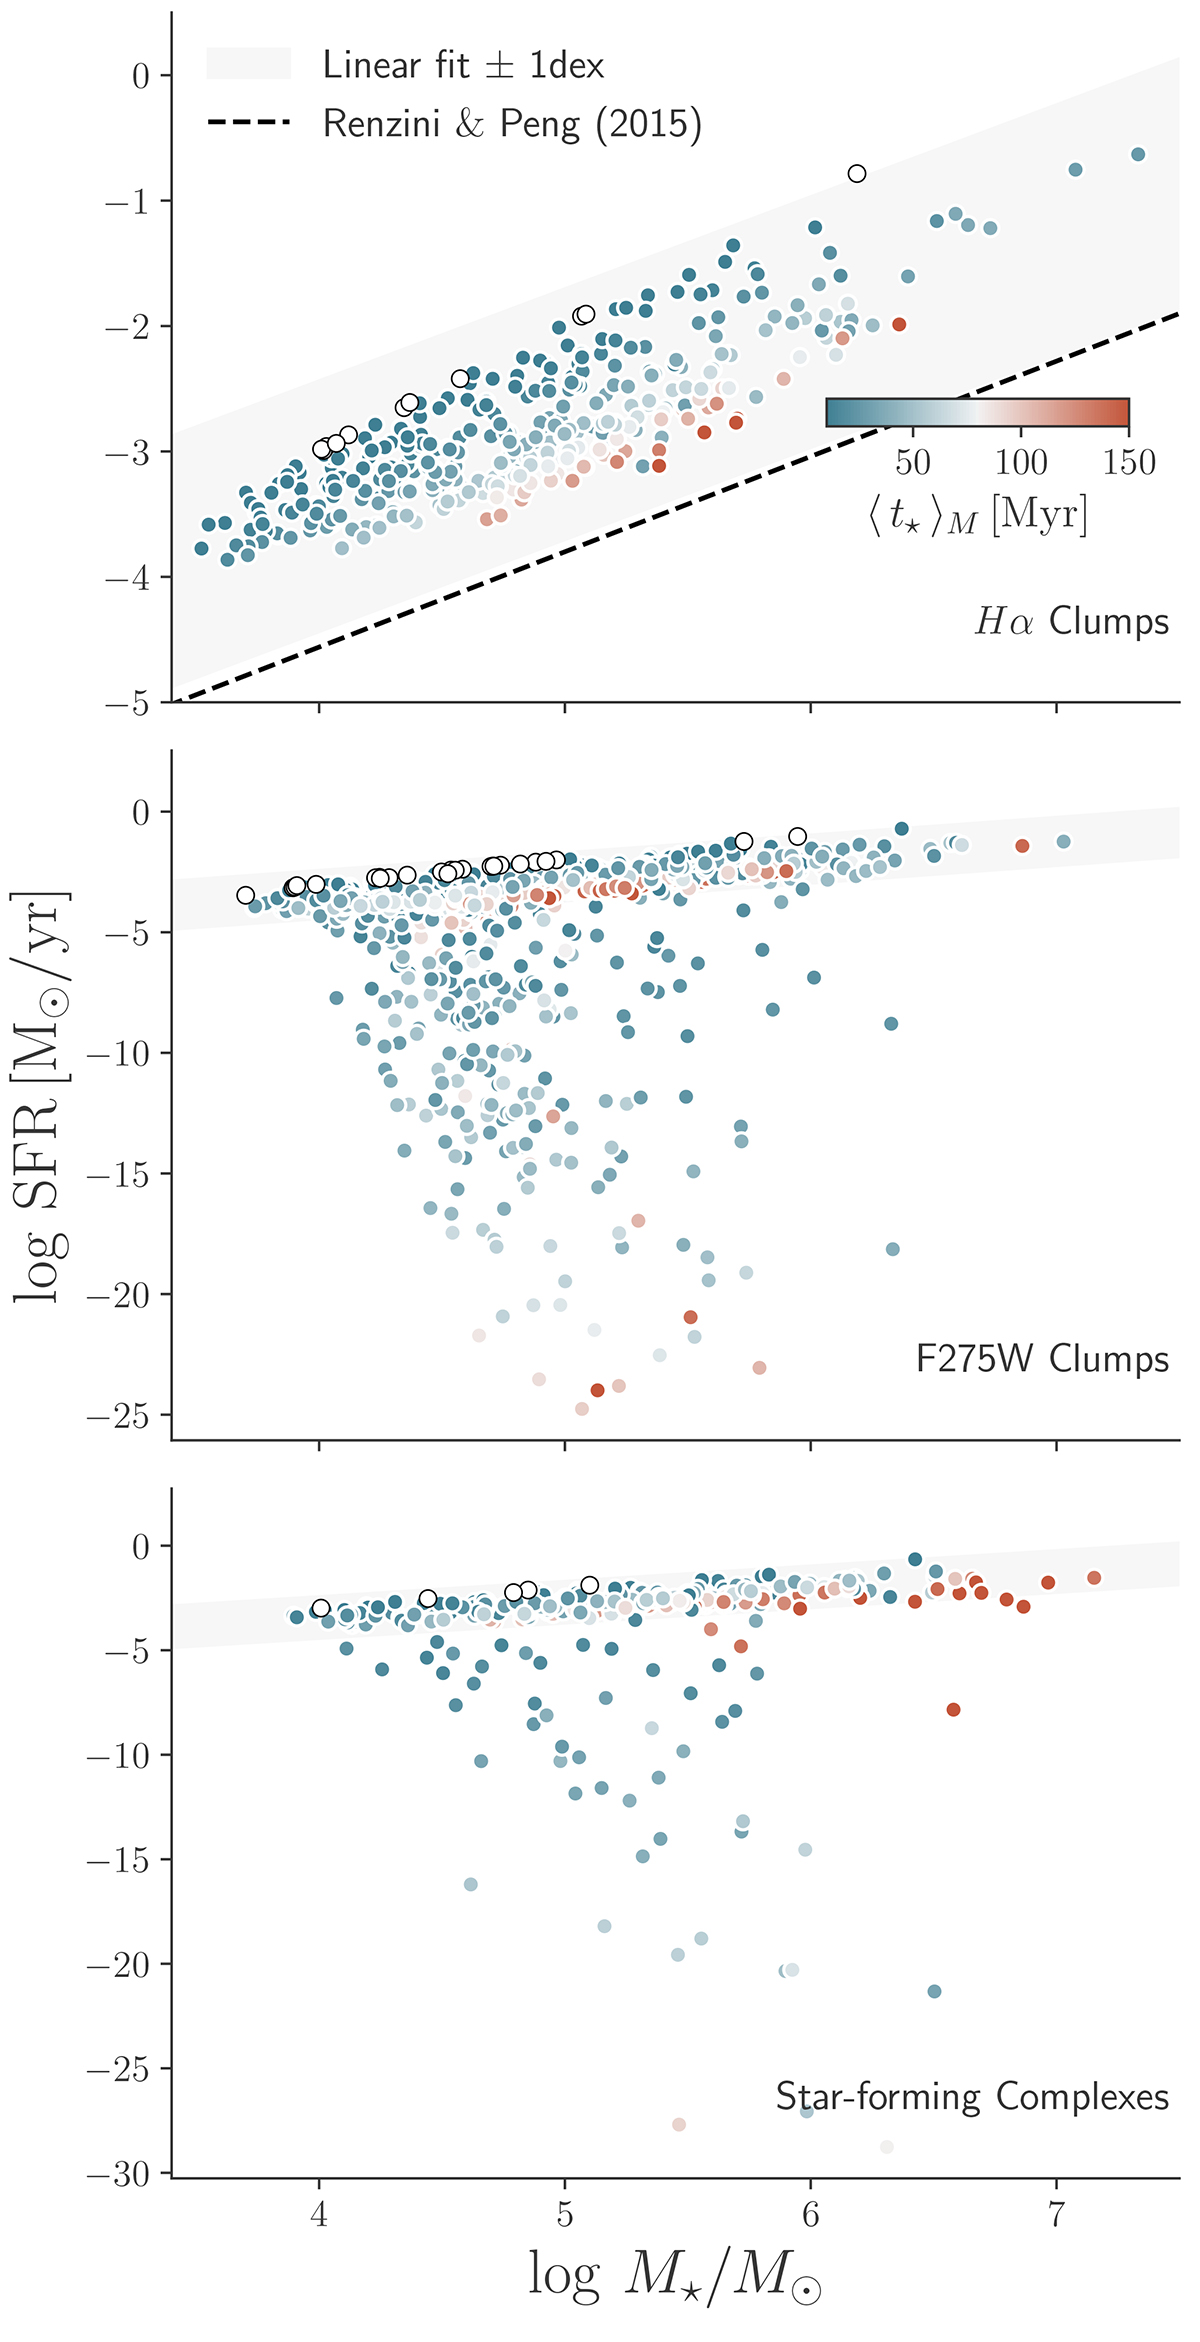
Stellar mass–SFR relation for clumps and complexes in our sample. Panels from top to bottom show the relations for Hα clumps, F275W clumps and star-forming complexes, respectively. Points are colored according to ⟨ t⋆ ⟩M, truncating at 10 Myr and 150 Myr, clumps containing only stars younger than 10 Myr form a relation by definition and are shown as white circles. The gray band indicates a ±1 dex range around a linear fit to the Hα relation, the dashed line shows a fit to the relation for star-forming galaxies in the Sloan Digital Sky Survey from Renzini & Peng (2015). For F275W clumps and star-forming complexes we set the lower limit of the y-axis to the 1% percentile of the SFR distribution.
Current usage metrics show cumulative count of Article Views (full-text article views including HTML views, PDF and ePub downloads, according to the available data) and Abstracts Views on Vision4Press platform.
Data correspond to usage on the plateform after 2015. The current usage metrics is available 48-96 hours after online publication and is updated daily on week days.
Initial download of the metrics may take a while.