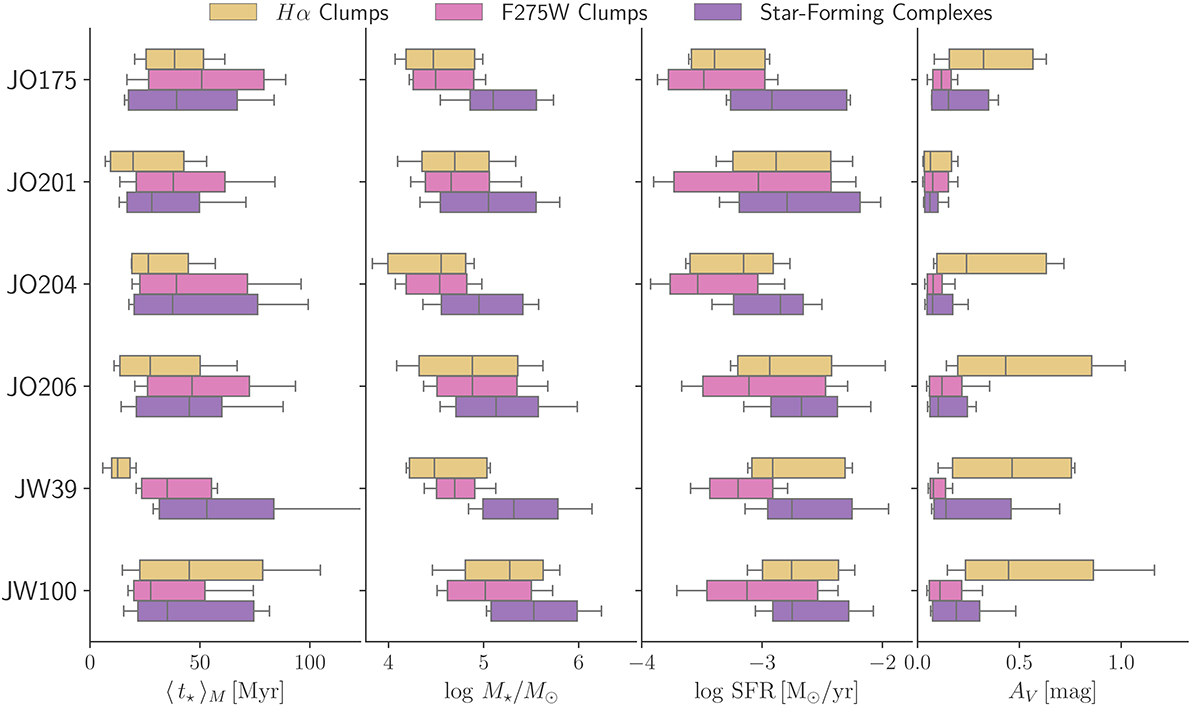
Fig. 4.
Download original image
Box plots showing galaxy-to-galaxy variations of the distributions shown in Fig. 3. As before, clumps detected in Hα and F275W are shown in gold and in dark pink, respectively, and star-forming complexes are shown in purple. Boxes span the interquartile regions, horizontal lines in the boxes indicate the median and whiskers mark the 15% and 85% percentiles of the distributions.
Current usage metrics show cumulative count of Article Views (full-text article views including HTML views, PDF and ePub downloads, according to the available data) and Abstracts Views on Vision4Press platform.
Data correspond to usage on the plateform after 2015. The current usage metrics is available 48-96 hours after online publication and is updated daily on week days.
Initial download of the metrics may take a while.