Fig. 3.
Download original image
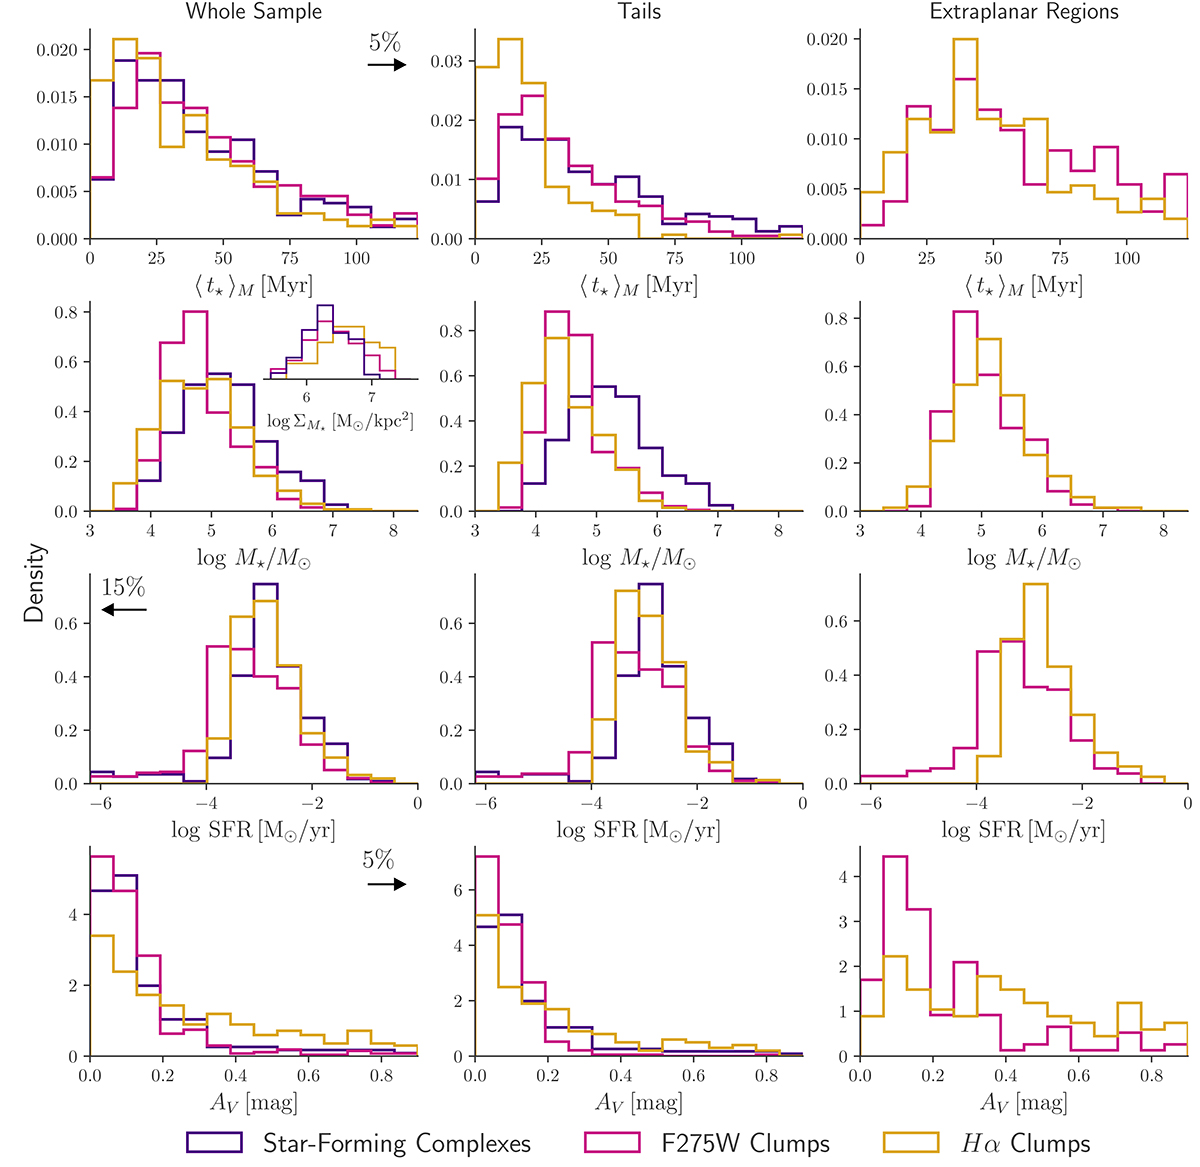
Distributions of (from top to bottom) mass-weighted ages, stellar masses, SFRs, and dust attenuation of clumps detected in Hα (in gold) and F275W (in dark pink), and star-forming complexes (in purple). We limit the histograms to the 95th percentiles of ⟨ t⋆⟩M and AV, and to the 15th percentile of SFR. These percentiles are calculated for the combined (all clumps and complexes) samples and the ranges are kept the same in all histograms of the same variable. Left panels show the general samples, tail clumps and complexes are in the middle panels and extraplanar clumps are on the right. Histograms are normalized to have the same area.
Current usage metrics show cumulative count of Article Views (full-text article views including HTML views, PDF and ePub downloads, according to the available data) and Abstracts Views on Vision4Press platform.
Data correspond to usage on the plateform after 2015. The current usage metrics is available 48-96 hours after online publication and is updated daily on week days.
Initial download of the metrics may take a while.