Fig. 2.

Download original image
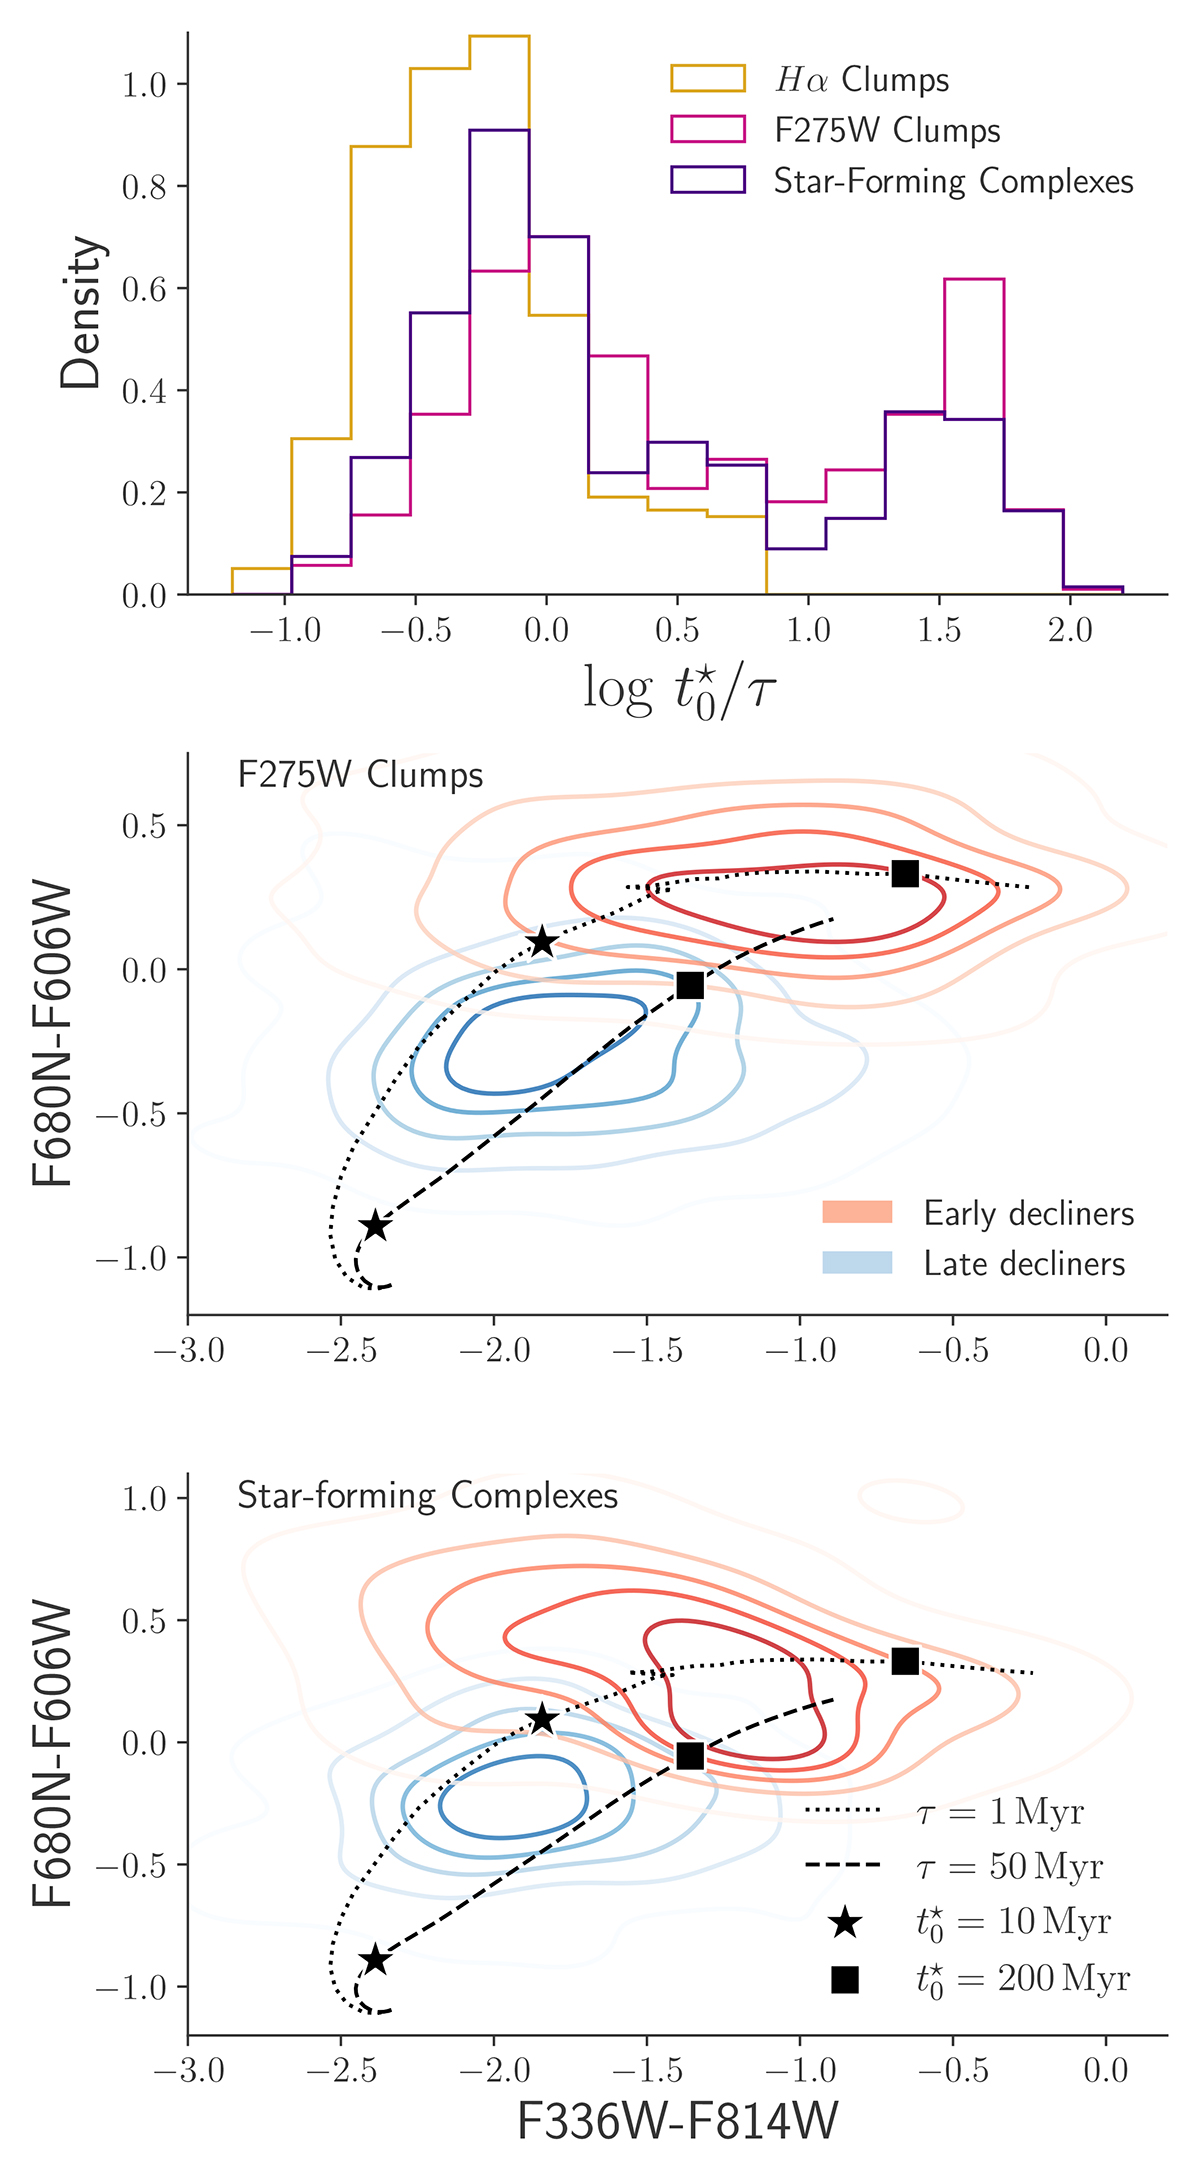
Early and late decliners and their observed properties. Top: Histograms tracing the distributions of the SFH decay proxy ![]() for Hα clumps (gold), F275W clumps (pink), and star-forming complexes (purple). Middle and bottom panels show F680N–F606W vs. F336W–F814W color-color diagrams for F275W clumps and star-forming complexes, respectively. Contours in the color-color diagrams trace 2D kernel density estimations tracing the loci of late (blue) and early (red) decliners (see text for details); dotted and dashed lines indicate BAGPIPES models of different ages and τ = 1 Myr and 50 Myr, respectively. The position of models with
for Hα clumps (gold), F275W clumps (pink), and star-forming complexes (purple). Middle and bottom panels show F680N–F606W vs. F336W–F814W color-color diagrams for F275W clumps and star-forming complexes, respectively. Contours in the color-color diagrams trace 2D kernel density estimations tracing the loci of late (blue) and early (red) decliners (see text for details); dotted and dashed lines indicate BAGPIPES models of different ages and τ = 1 Myr and 50 Myr, respectively. The position of models with ![]() values of 10 Myr (stars) and 200 Myr (squares) along each of the lines of constant τ is marked in both diagrams.
values of 10 Myr (stars) and 200 Myr (squares) along each of the lines of constant τ is marked in both diagrams.
Current usage metrics show cumulative count of Article Views (full-text article views including HTML views, PDF and ePub downloads, according to the available data) and Abstracts Views on Vision4Press platform.
Data correspond to usage on the plateform after 2015. The current usage metrics is available 48-96 hours after online publication and is updated daily on week days.
Initial download of the metrics may take a while.


