Fig. C.1.
Download original image
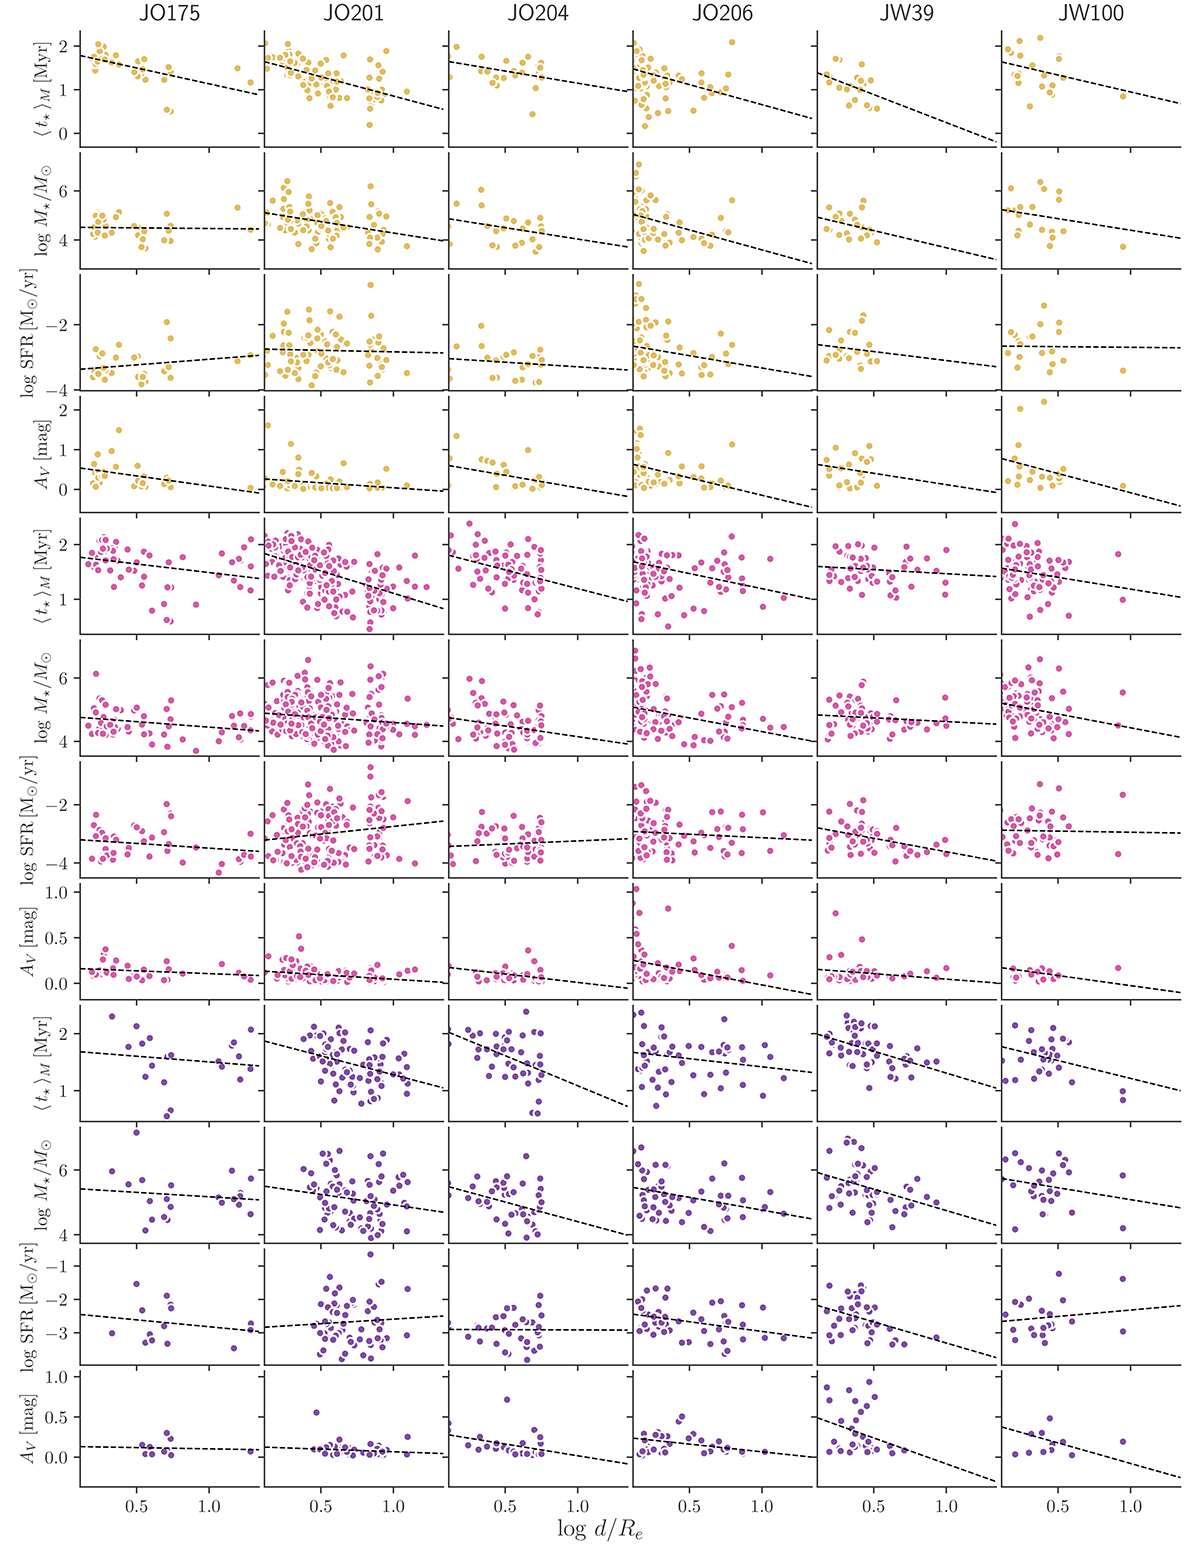
⟨ t⋆ ⟩M, log M⋆, SFR, and AV of clumps and complexes plotted against the normalized log distance log d/Re to the center of the host galaxy. Each column of panels corresponds to a different galaxy. Top panels show data for Hα clumps (gold), middle panels show F275W clumps (pink) and bottom panels show star-forming complexes (purple). Black dashed lines show linear fits to the relations. For SFR and AV we use the same selection as in Fig. 6.
Current usage metrics show cumulative count of Article Views (full-text article views including HTML views, PDF and ePub downloads, according to the available data) and Abstracts Views on Vision4Press platform.
Data correspond to usage on the plateform after 2015. The current usage metrics is available 48-96 hours after online publication and is updated daily on week days.
Initial download of the metrics may take a while.