Fig. B.1.
Download original image
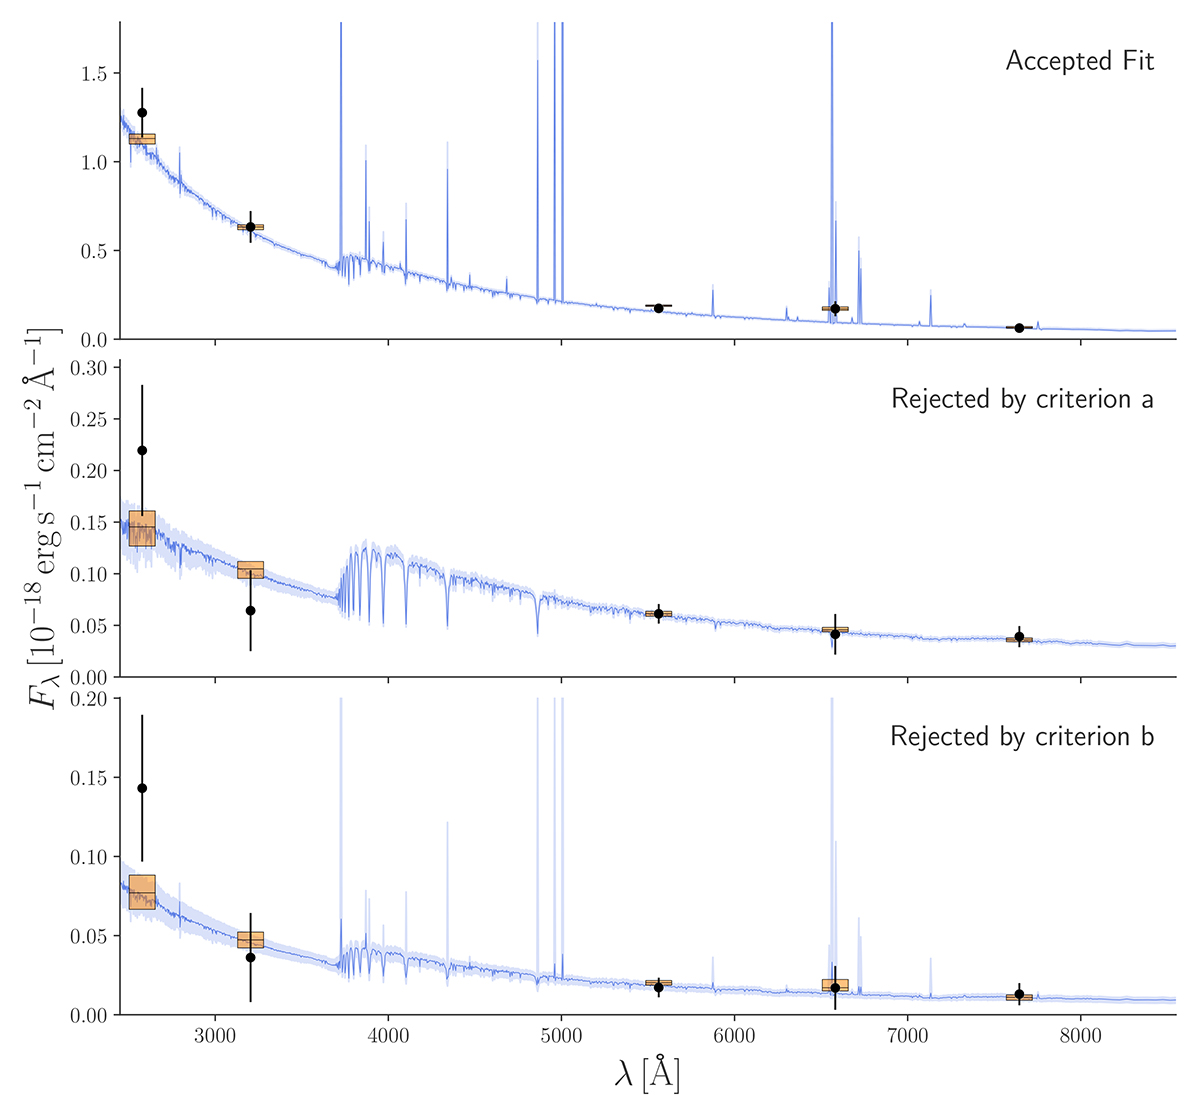
Examples of BAGPIPES fits accepted (top) and rejected according to quality control criteria a and b (middle and bottom, see text for details). Black points with errorbars show observed photometric fluxes in the five HST bands used in this work. Blue lines show the median of all models generated in the fit, and the shaded regions indicate interquartile ranges. Rectangles show the interquartile ranges of the modeled photometric fluxes, with horizontal lines indicating their median.
Current usage metrics show cumulative count of Article Views (full-text article views including HTML views, PDF and ePub downloads, according to the available data) and Abstracts Views on Vision4Press platform.
Data correspond to usage on the plateform after 2015. The current usage metrics is available 48-96 hours after online publication and is updated daily on week days.
Initial download of the metrics may take a while.