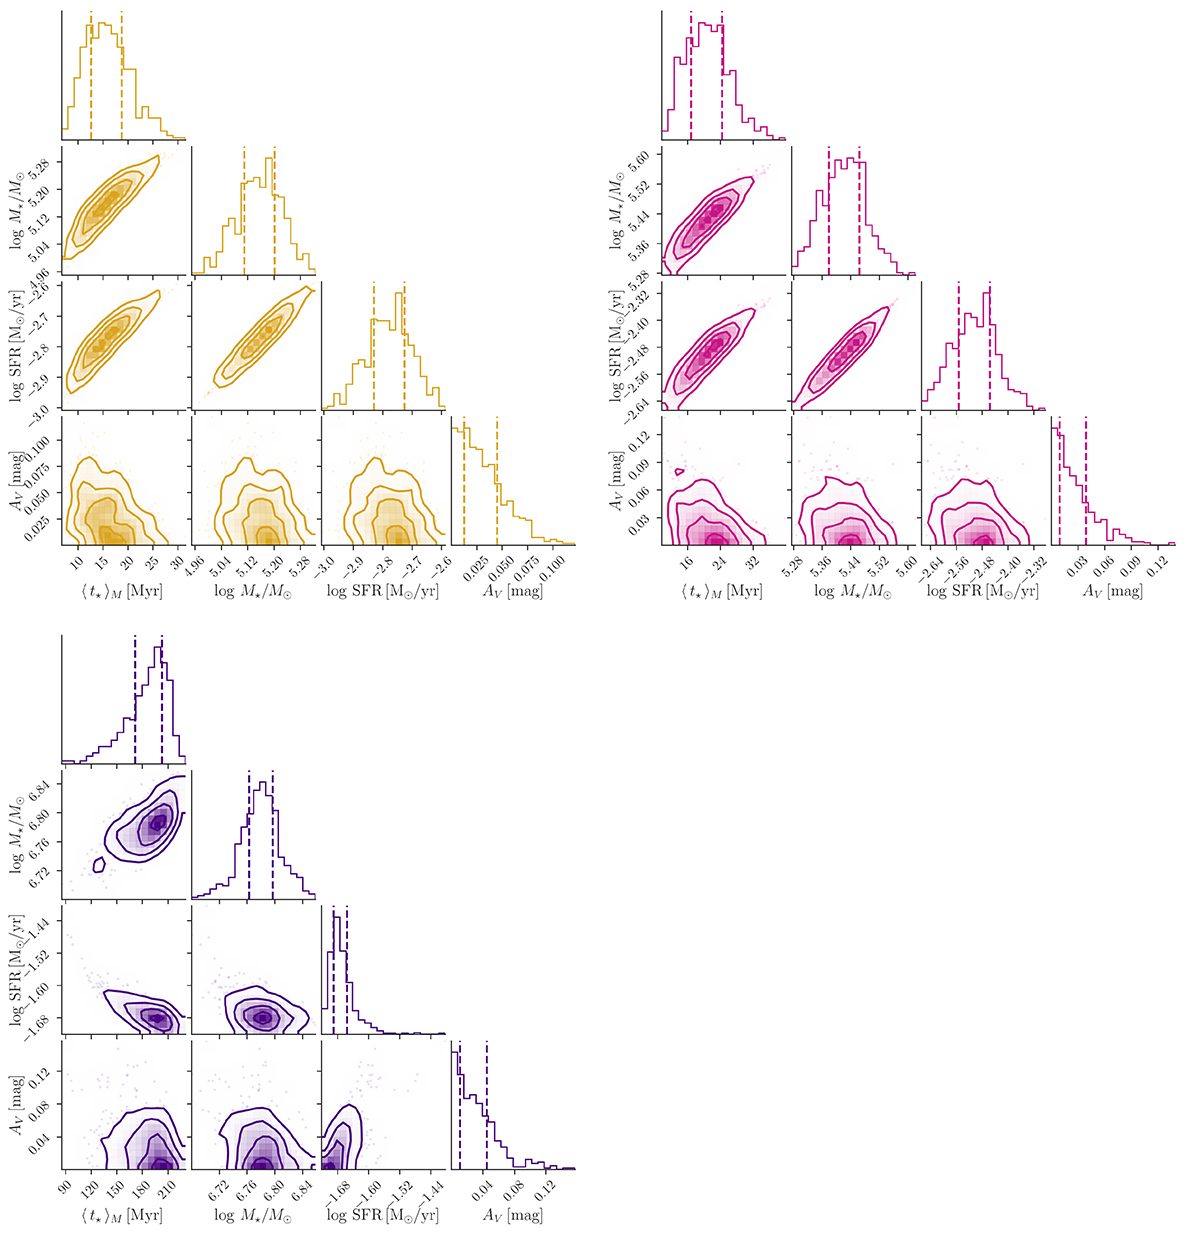
Fig. A.1.
Download original image
Corner plots showing 2D projections of the fitted parameter space for the three example fits shown in Fig. 1. The Hα clump in the top left, the F275W clump in the top right, and the star-forming complex at the bottom are color-coded as in Fig. 1. We include the four main variables used in our analysis: ⟨ t⋆ ⟩M, log M⋆, log SFR, and AV.
Current usage metrics show cumulative count of Article Views (full-text article views including HTML views, PDF and ePub downloads, according to the available data) and Abstracts Views on Vision4Press platform.
Data correspond to usage on the plateform after 2015. The current usage metrics is available 48-96 hours after online publication and is updated daily on week days.
Initial download of the metrics may take a while.