Fig. 12.
Download original image
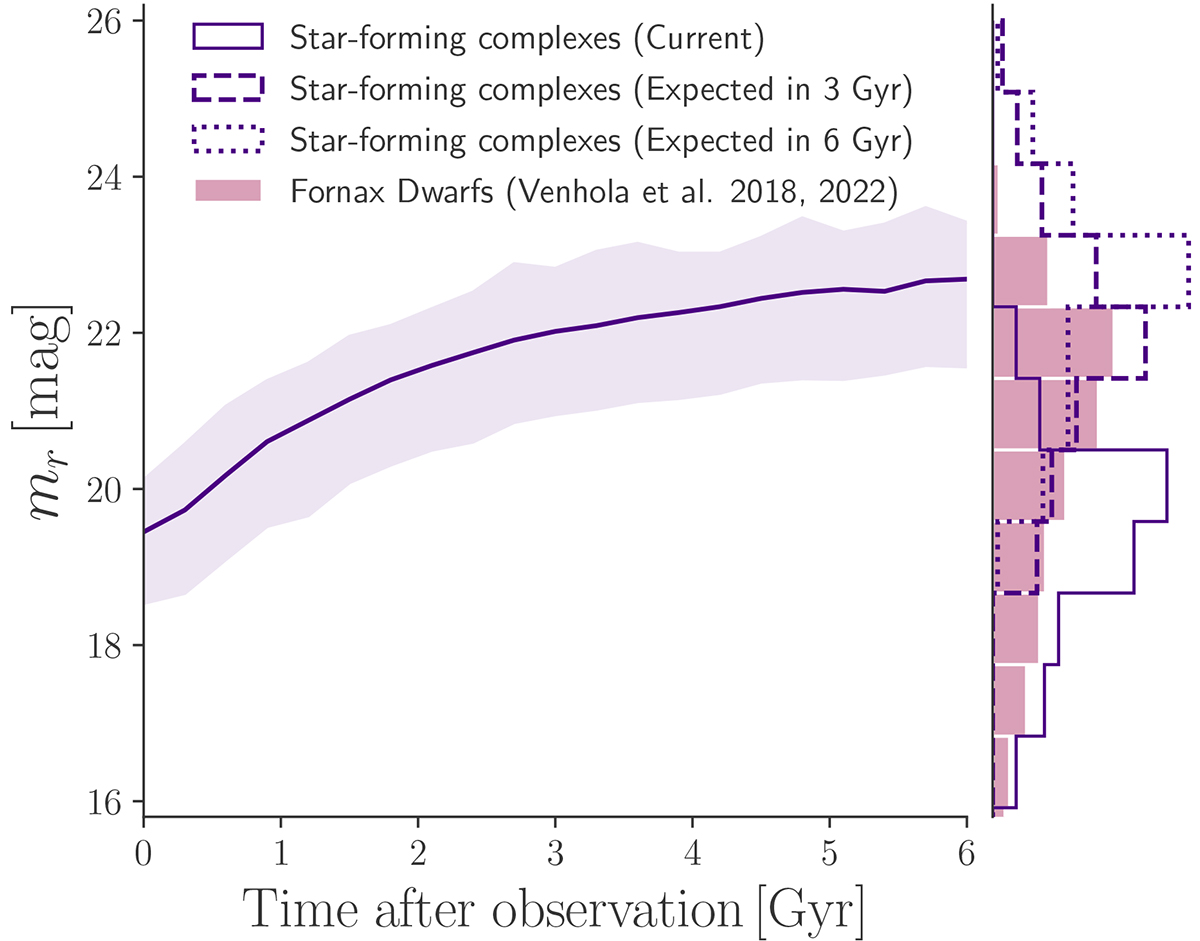
Extrapolated r-band apparent magnitude evolution in of star-forming complexes in the next 6 Gyr, placing them at the redshift of the Fornax cluster. The solid line shows the median extrapolated magnitude in each time step and the shaded region traces the 25th and 75th percentiles. Projected histograms show the magnitude distribution for Fornax dwarfs (pink), current magnitude distribution of star-forming complexes (solid purple) and the expected distribution in 3 and 6 Gyr (dashed and dotted purple, respectively). Only complexes older than 50 Myr are included.
Current usage metrics show cumulative count of Article Views (full-text article views including HTML views, PDF and ePub downloads, according to the available data) and Abstracts Views on Vision4Press platform.
Data correspond to usage on the plateform after 2015. The current usage metrics is available 48-96 hours after online publication and is updated daily on week days.
Initial download of the metrics may take a while.