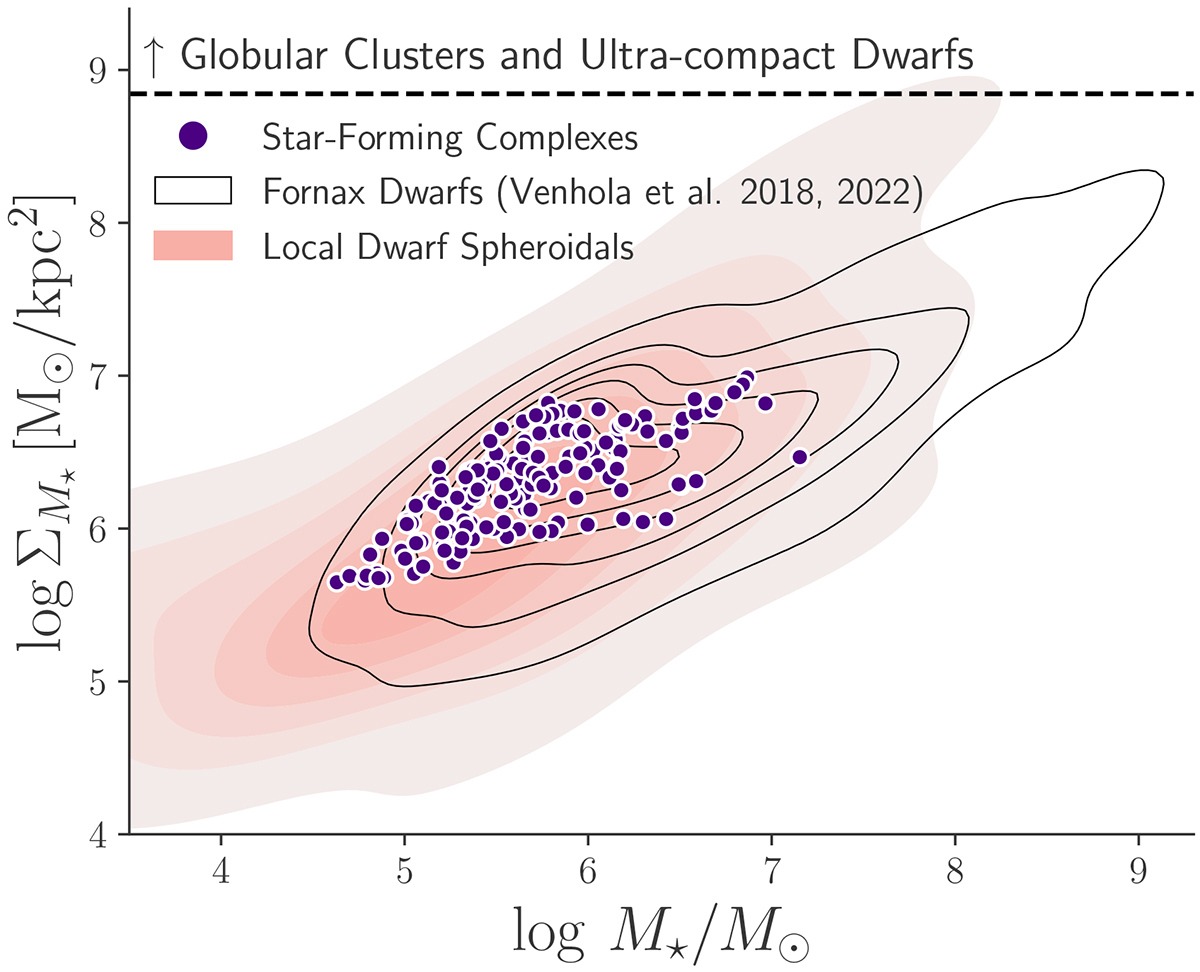
Fig. 11.
Download original image
log M⋆ – log ΣM⋆ relation for star-forming complexes (purple). Dashed line traces the 5% percentile of log ΣM⋆ for globular clusters and ultra-compact dwarfs. Red and black contours trace the distributions of local dwarf spheroidals from Norris et al. (2014) Fornax dwarf galaxies from Venhola et al. (2018, 2022).
Current usage metrics show cumulative count of Article Views (full-text article views including HTML views, PDF and ePub downloads, according to the available data) and Abstracts Views on Vision4Press platform.
Data correspond to usage on the plateform after 2015. The current usage metrics is available 48-96 hours after online publication and is updated daily on week days.
Initial download of the metrics may take a while.