Fig. 1.
Download original image
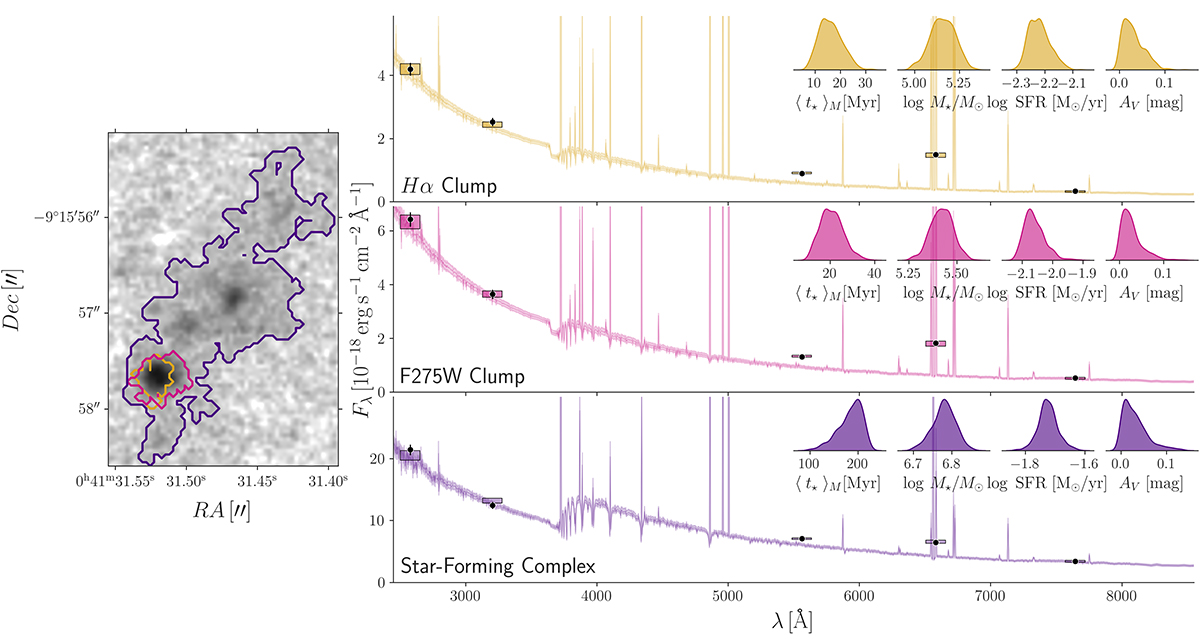
Examples of BAGPIPES fits for clumps selected from Hα, F275W, and F606W images. On the left: F275W image of a region in the tail of JO201; regions in golden yellow, pink and purple indicate an Hα clump, a UV clump and a star-forming complex, respectively. On the right: Examples of BAGPIPES fits to the photometry of the regions indicated on the image to the left; shaded region corresponds to the full range of the model spectra PDF and are plotted with the same color as the corresponding region in the image; black points with errorbars (generally too small to be seen) indicate the observed photometric fluxes in the five HST bands used in this work. Rectangles show the region between the 1% and 99% percentiles of the photometric fluxes fitted by BAGPIPES. Inset plots in the right panels show the posterior PDFs of mass-weighted ages (⟨t⋆⟩), stellar masses (log M⋆/M⊙), SFRs, and AV derived for each object.
Current usage metrics show cumulative count of Article Views (full-text article views including HTML views, PDF and ePub downloads, according to the available data) and Abstracts Views on Vision4Press platform.
Data correspond to usage on the plateform after 2015. The current usage metrics is available 48-96 hours after online publication and is updated daily on week days.
Initial download of the metrics may take a while.