Fig. 9

Download original image
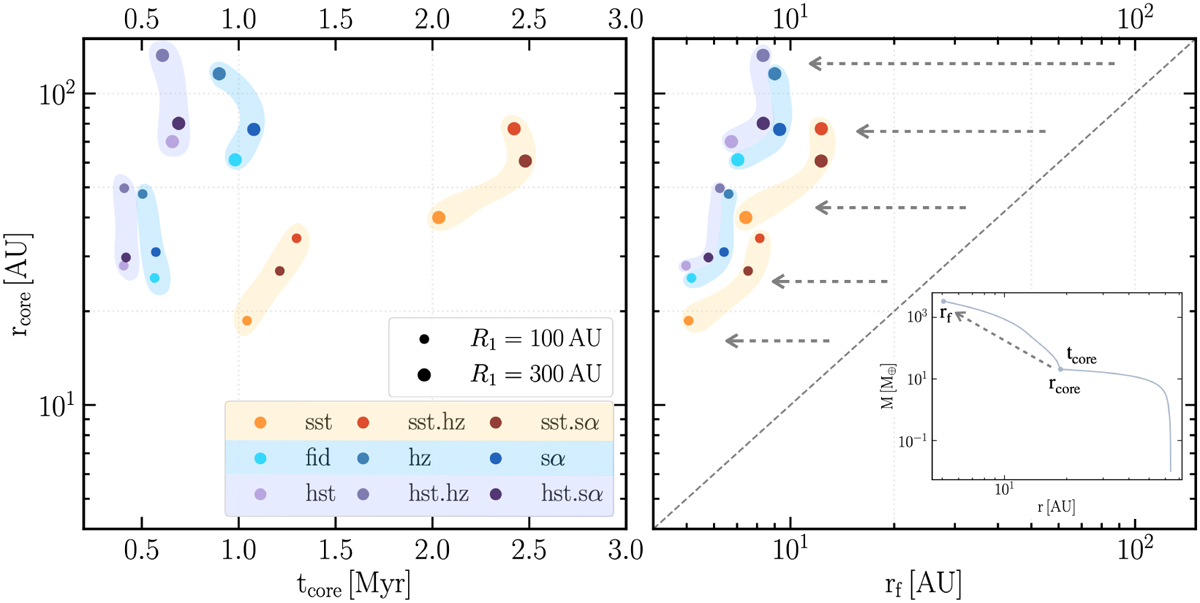
Location and formation time of the furthest cores simulated in different scenarios from Table 2 when protoplanets emerge at t0,p = 0.2 Myr (left). Scenarios with the same St are highlighted by their colored groups. Final location of the furthest cores after gas accretion (Sect. 4.1) and type II migration (Sect. 2.5) at the end of the disk lifetime of 5 Myr (right). An example growth track is shown at the bottom-right to facilitate the readability of the axes. In all scenarios, protoplanets migrate several AU during gas accretion. This phenomenon is visually depicted as a significant horizontal displacement from the diagonal line rcore = rf. The displacement is more pronounced in disks with high St (purple and blue groups) due to an earlier formation of the cores.
Current usage metrics show cumulative count of Article Views (full-text article views including HTML views, PDF and ePub downloads, according to the available data) and Abstracts Views on Vision4Press platform.
Data correspond to usage on the plateform after 2015. The current usage metrics is available 48-96 hours after online publication and is updated daily on week days.
Initial download of the metrics may take a while.


