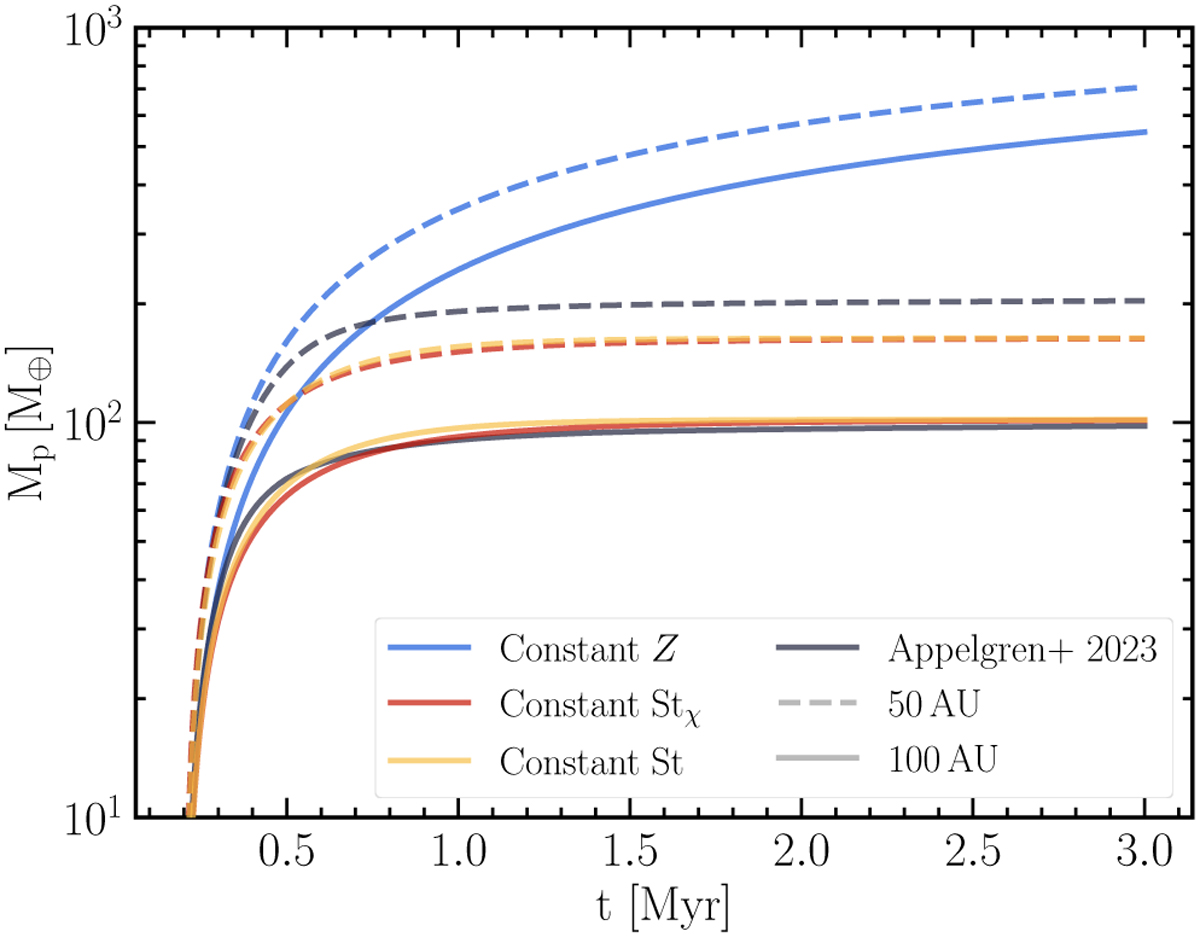
Fig. 5
Download original image
Cumulative mass of drifting pebbles crossing 50 AU and 100 AU according to different analytical models and according to the numerical simulation from Appelgren et al. (2023). In the analytical models shown here, we assume that pebbles have grown to completion and started drifting at t0 = 0.2 Myr and that the initial metallicity is Z0 = 0.008. Assuming constant Z over time (blue line) significantly overestimates the crossing mass compared to the simulation (black line). In contrast, the cumulative masses from the new analytical models (red and yellow lines) approach the simulated case. We note that at 50 AU, the cumulative masses from these analytical models are slightly underestimated when comparing to the simulated case since Z0(50 AU) > 0.008 in the simulation.
Current usage metrics show cumulative count of Article Views (full-text article views including HTML views, PDF and ePub downloads, according to the available data) and Abstracts Views on Vision4Press platform.
Data correspond to usage on the plateform after 2015. The current usage metrics is available 48-96 hours after online publication and is updated daily on week days.
Initial download of the metrics may take a while.