Fig. 4
Download original image
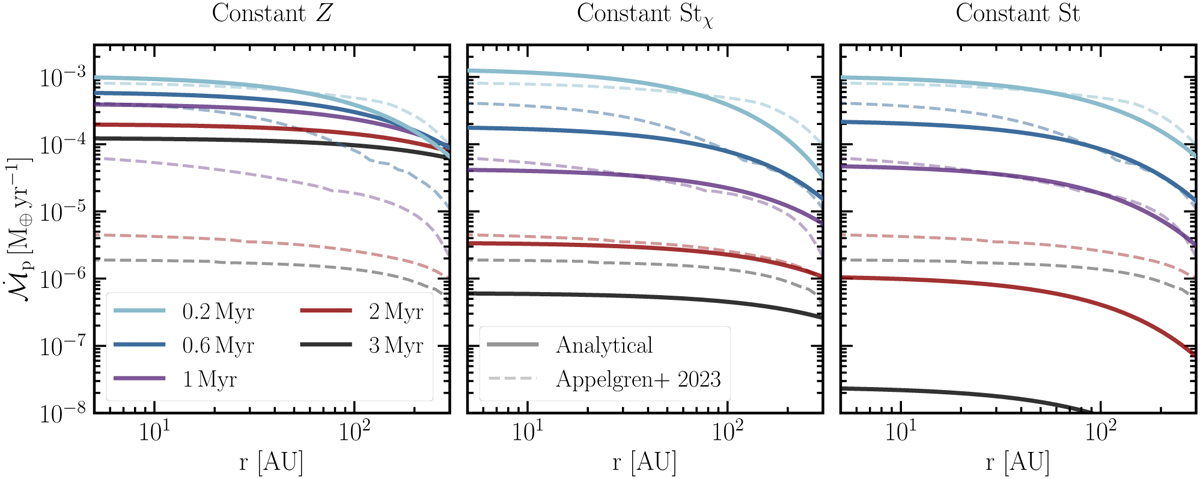
Comparison between the analytical model (solid lines) with the numerical simulations from Appelgren et al. (2023; dashed lines) at different times. We assume Z0 = 0.008 and ![]() to match the simulation, and St= 0.03 in the three analytical expressions. Left: assuming constant metallicity Z(r, t) = Z0 significantly overestimates the pebble flux over the lifespan of the disk. Center: assuming constant Stχ (see Eq. (32)) gives a relatively good match to the overall behavior of the pebble flux. Right: assuming constant St gives an accurate description over the first ~1 Myr, but it severely underestimates the flux at late times, since the value of St is limited by the growth timescale (see Fig. 2) in the outer disk in the simulations.
to match the simulation, and St= 0.03 in the three analytical expressions. Left: assuming constant metallicity Z(r, t) = Z0 significantly overestimates the pebble flux over the lifespan of the disk. Center: assuming constant Stχ (see Eq. (32)) gives a relatively good match to the overall behavior of the pebble flux. Right: assuming constant St gives an accurate description over the first ~1 Myr, but it severely underestimates the flux at late times, since the value of St is limited by the growth timescale (see Fig. 2) in the outer disk in the simulations.
Current usage metrics show cumulative count of Article Views (full-text article views including HTML views, PDF and ePub downloads, according to the available data) and Abstracts Views on Vision4Press platform.
Data correspond to usage on the plateform after 2015. The current usage metrics is available 48-96 hours after online publication and is updated daily on week days.
Initial download of the metrics may take a while.