Fig. E.1
Download original image
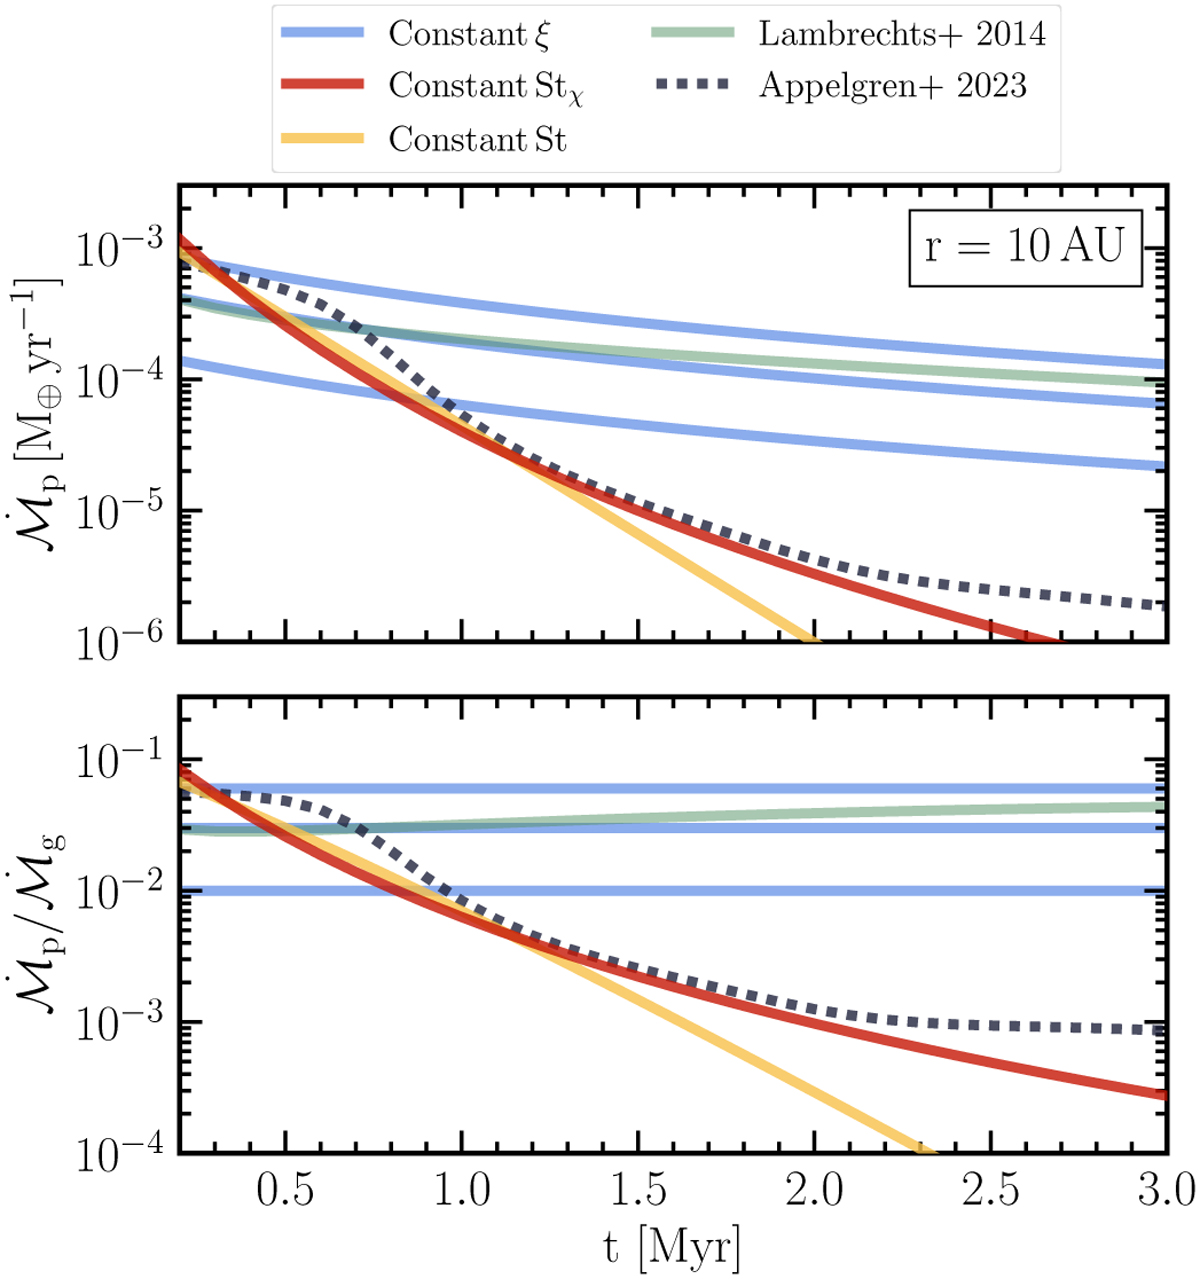
Evolution of the pebble flux (top) and the pebble-to-gas flux ratio (bottom) at 10 AU according to different analytical models and according to the simulation from Appelgren et al. (2023). Analytical models are described in Eq. (E.1) for a constant ξ = 0.01,0.03 or 0.06, Eqs. (36) and (32) for a constant Stχ, and St, respectively, and Eq. (E.2) for the pebble flux derived by Lambrechts & Johansen (2014). We assumed Z0 = 0.008 and ![]() to match the simulation, and the rest of the parameter values are listed in Table 1. The simulation shows that, for the given disk parameters, the pebbles deplete on a shorter timescale than the gas due to the radial drift. This behavior is exhibited in the analytical models with a constant Stχ, and constant St.
to match the simulation, and the rest of the parameter values are listed in Table 1. The simulation shows that, for the given disk parameters, the pebbles deplete on a shorter timescale than the gas due to the radial drift. This behavior is exhibited in the analytical models with a constant Stχ, and constant St.
Current usage metrics show cumulative count of Article Views (full-text article views including HTML views, PDF and ePub downloads, according to the available data) and Abstracts Views on Vision4Press platform.
Data correspond to usage on the plateform after 2015. The current usage metrics is available 48-96 hours after online publication and is updated daily on week days.
Initial download of the metrics may take a while.