Fig. A.1
Download original image
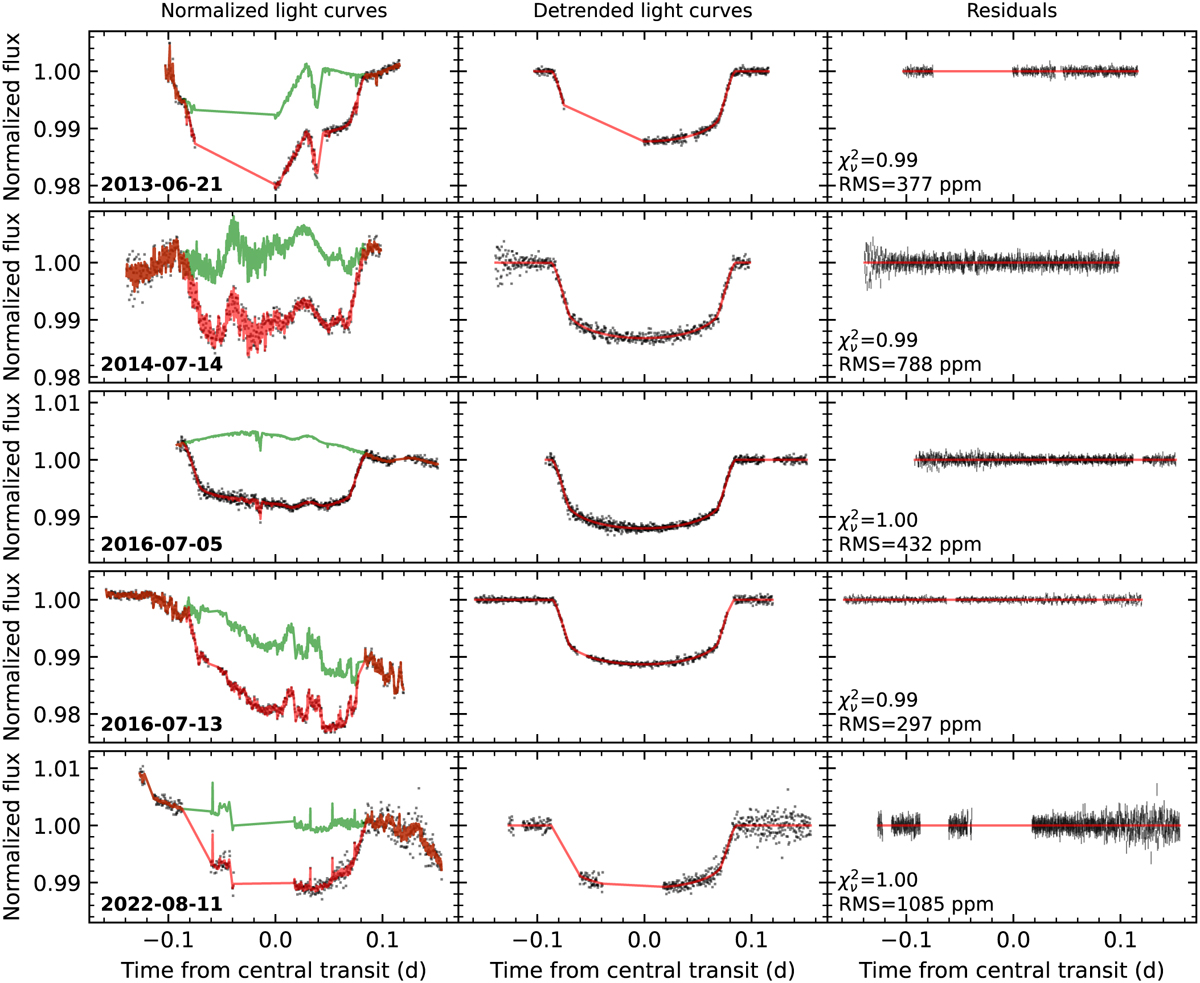
Fitting results of the broadband transit light curves of HAT-P-41b. Each row corresponds to one transit observation. Left column: Normalized fluxes (black error bars), the best-fit models (red), and the systematic noise (green, also the common-mode systematics). Middle column: Detrended light curves and the best-fit transit models. Right column: Residuals.
Current usage metrics show cumulative count of Article Views (full-text article views including HTML views, PDF and ePub downloads, according to the available data) and Abstracts Views on Vision4Press platform.
Data correspond to usage on the plateform after 2015. The current usage metrics is available 48-96 hours after online publication and is updated daily on week days.
Initial download of the metrics may take a while.