Fig. 5
Download original image
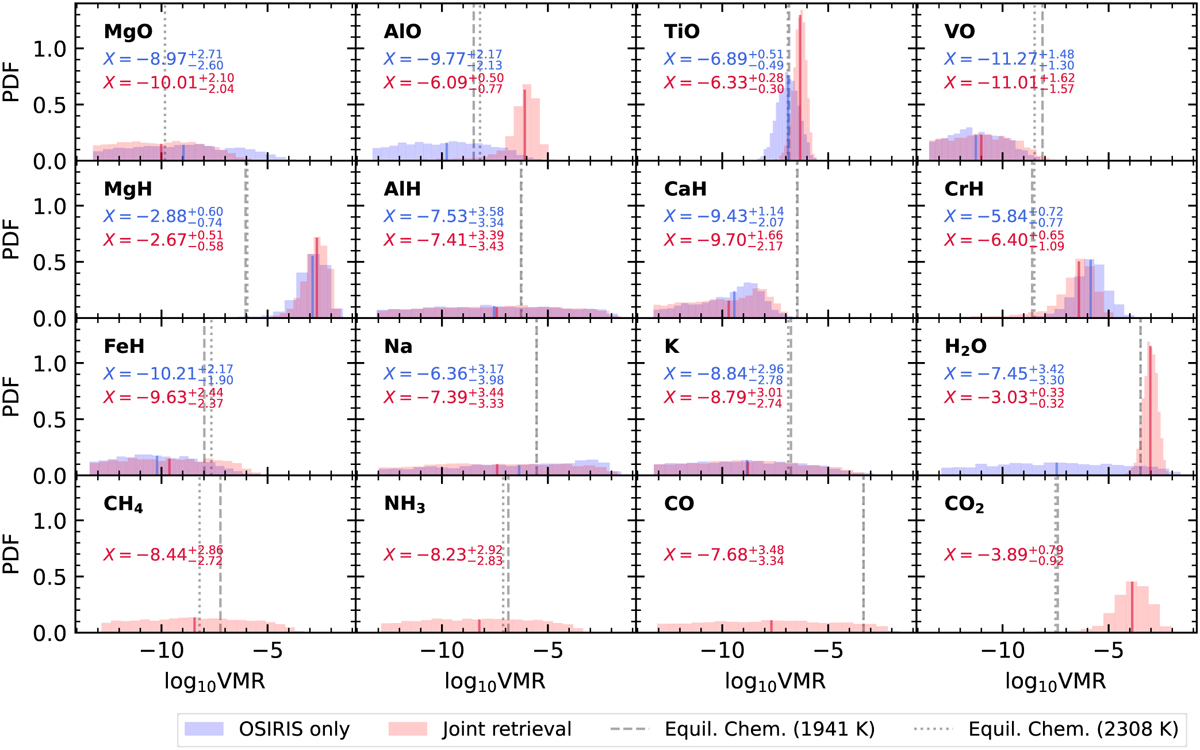
Posterior distributions of the VMRs of chemical species constrained by the OSIRIS transmission spectrum (blue) and the optical-to-NIR joint spectrum (red). The symbol X denotes the median logarithmic VMR (log10 VMR) of the corresponding color. The gray lines indicate the VMRs calculated using GGChem equilibrium chemistry (Woitke et al. 2018) assuming solar abundances at a pressure of 1 bar, where two planetary equilibrium temperatures were considered: 1941 K (dashed, assuming uniform heat redistribution) and 2308 K (dotted, assuming dayside heat redistribution only).
Current usage metrics show cumulative count of Article Views (full-text article views including HTML views, PDF and ePub downloads, according to the available data) and Abstracts Views on Vision4Press platform.
Data correspond to usage on the plateform after 2015. The current usage metrics is available 48-96 hours after online publication and is updated daily on week days.
Initial download of the metrics may take a while.