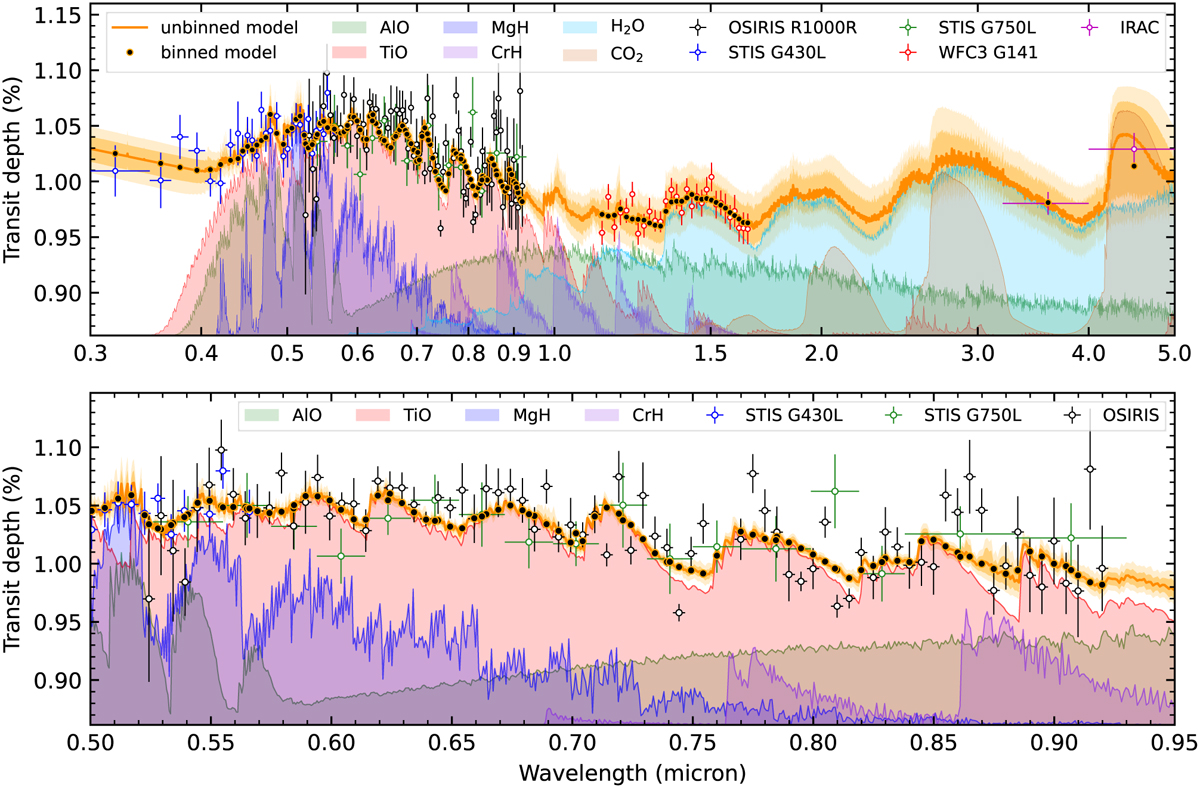
Fig. 4
Download original image
Retrieval results of HAT-P-41b using the optical-to-NIR joint transmission spectra. Upper panel: transmission spectra measured with different instruments, shown as the error bars, where the median instrumental offsets have been applied (−4 ppm for STIS, 758 ppm for G141, and 388 ppm for IRAC). The median and 2σ credible interval of the posterior models are shown as orange lines. The black dots are the median model after wavelength binning. The shaded regions below the posterior model indicate the reference models with only AlO (green), TiO (red), MgH (deep blue), CrH (purple), H2O (sky blue), and CO2 (brown). Lower panel: same as the upper panel, but zoomed into the wavelength range of the OSIRIS transmission spectrum.
Current usage metrics show cumulative count of Article Views (full-text article views including HTML views, PDF and ePub downloads, according to the available data) and Abstracts Views on Vision4Press platform.
Data correspond to usage on the plateform after 2015. The current usage metrics is available 48-96 hours after online publication and is updated daily on week days.
Initial download of the metrics may take a while.