Fig. 3
Download original image
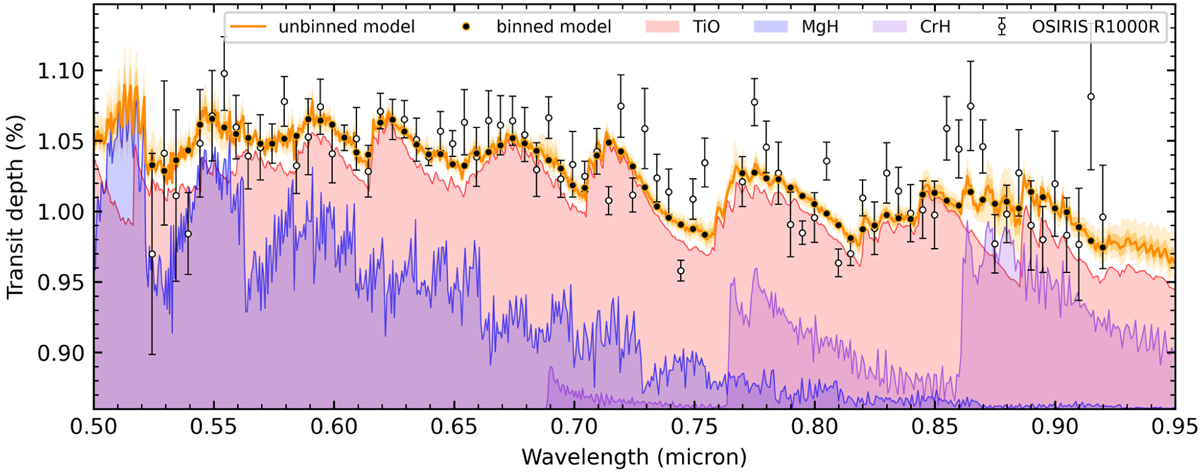
Retrieved transmission spectrum of HAT-P-41b observed with GTC OSIRIS. The error bars are the averaged OSIRIS transmission spectrum. The orange lines are the median and 2σ credible intervals of the posterior models. The black dots are the posterior model after wavelength binning to the observational passbands. The shaded regions below the posterior model indicate the reference models with only TiO (red), MgH (blue), or CrH (purple).
Current usage metrics show cumulative count of Article Views (full-text article views including HTML views, PDF and ePub downloads, according to the available data) and Abstracts Views on Vision4Press platform.
Data correspond to usage on the plateform after 2015. The current usage metrics is available 48-96 hours after online publication and is updated daily on week days.
Initial download of the metrics may take a while.