Open Access
Fig. 2
Download original image
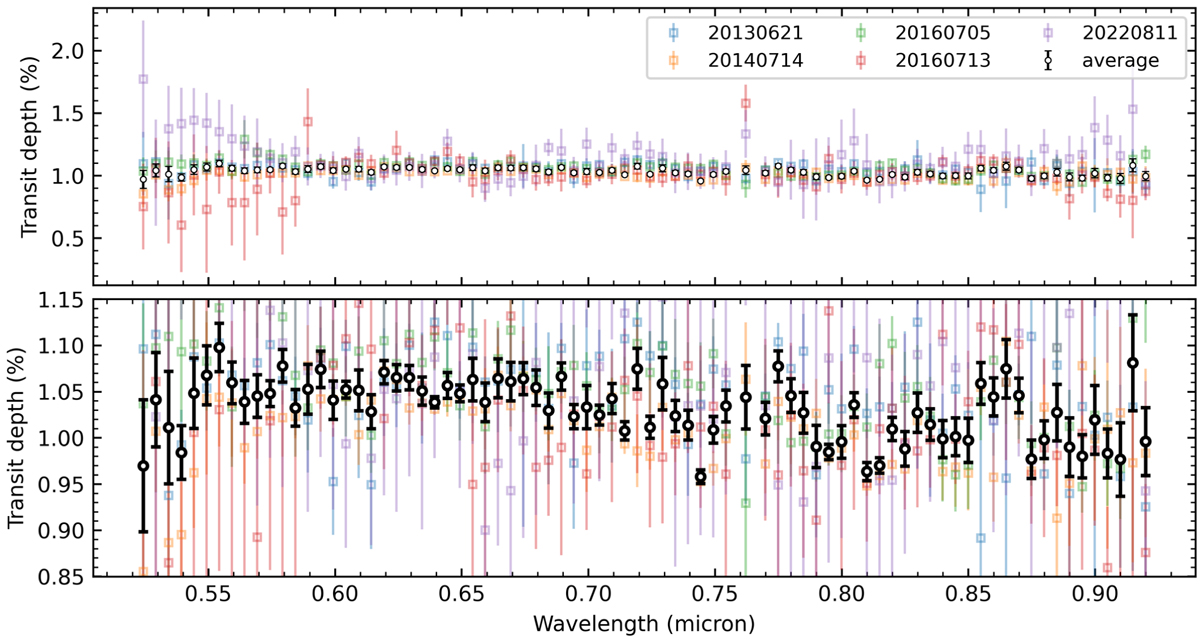
Transmission spectra of HAT-P-41b derived from the five transit observations with OSIRIS R1000R. Upper panel: five individual transmission spectra (colored error bars) and their weighted means (black error bars). Lower panel: same as the upper panel, but zoomed in for clarity.
Current usage metrics show cumulative count of Article Views (full-text article views including HTML views, PDF and ePub downloads, according to the available data) and Abstracts Views on Vision4Press platform.
Data correspond to usage on the plateform after 2015. The current usage metrics is available 48-96 hours after online publication and is updated daily on week days.
Initial download of the metrics may take a while.