Open Access
Fig. 1
Download original image
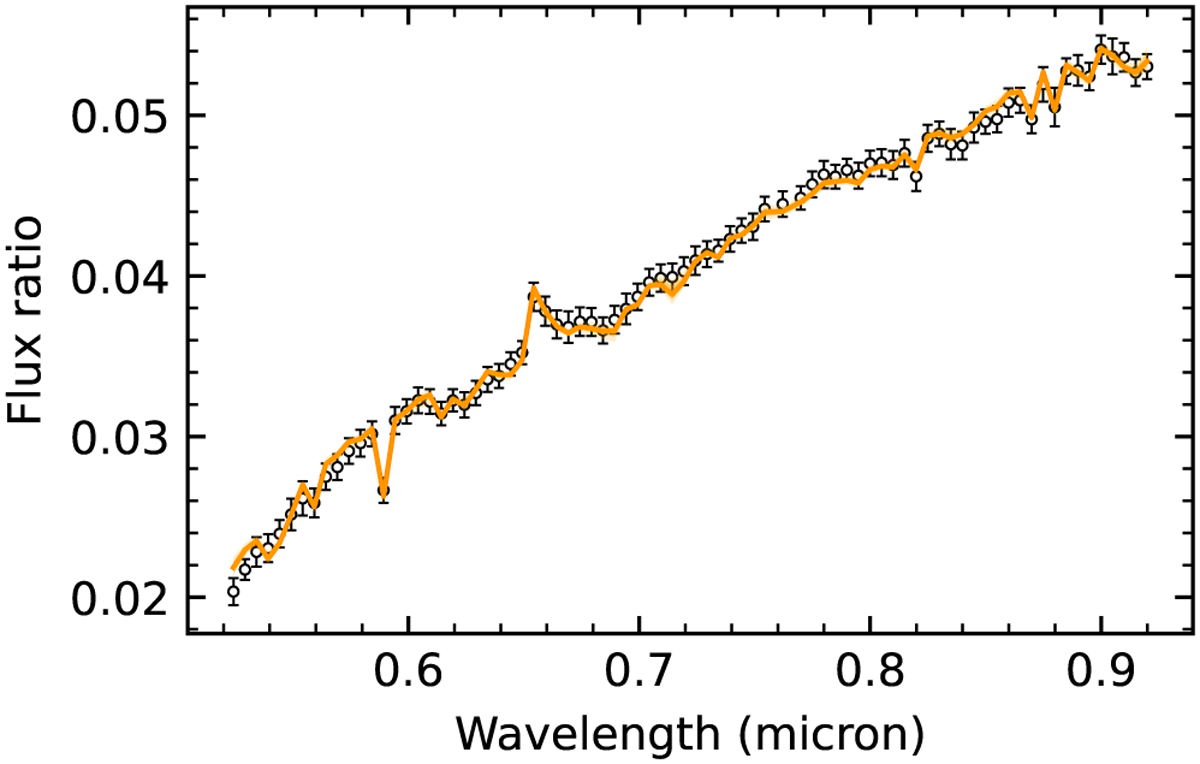
Narrowband flux ratios between the companion and HAT-P-41. The error bars are the observed flux ratios, and the orange line is the best-fit curve obtained using the PHOENIX model spectra.
Current usage metrics show cumulative count of Article Views (full-text article views including HTML views, PDF and ePub downloads, according to the available data) and Abstracts Views on Vision4Press platform.
Data correspond to usage on the plateform after 2015. The current usage metrics is available 48-96 hours after online publication and is updated daily on week days.
Initial download of the metrics may take a while.