Fig. 1.
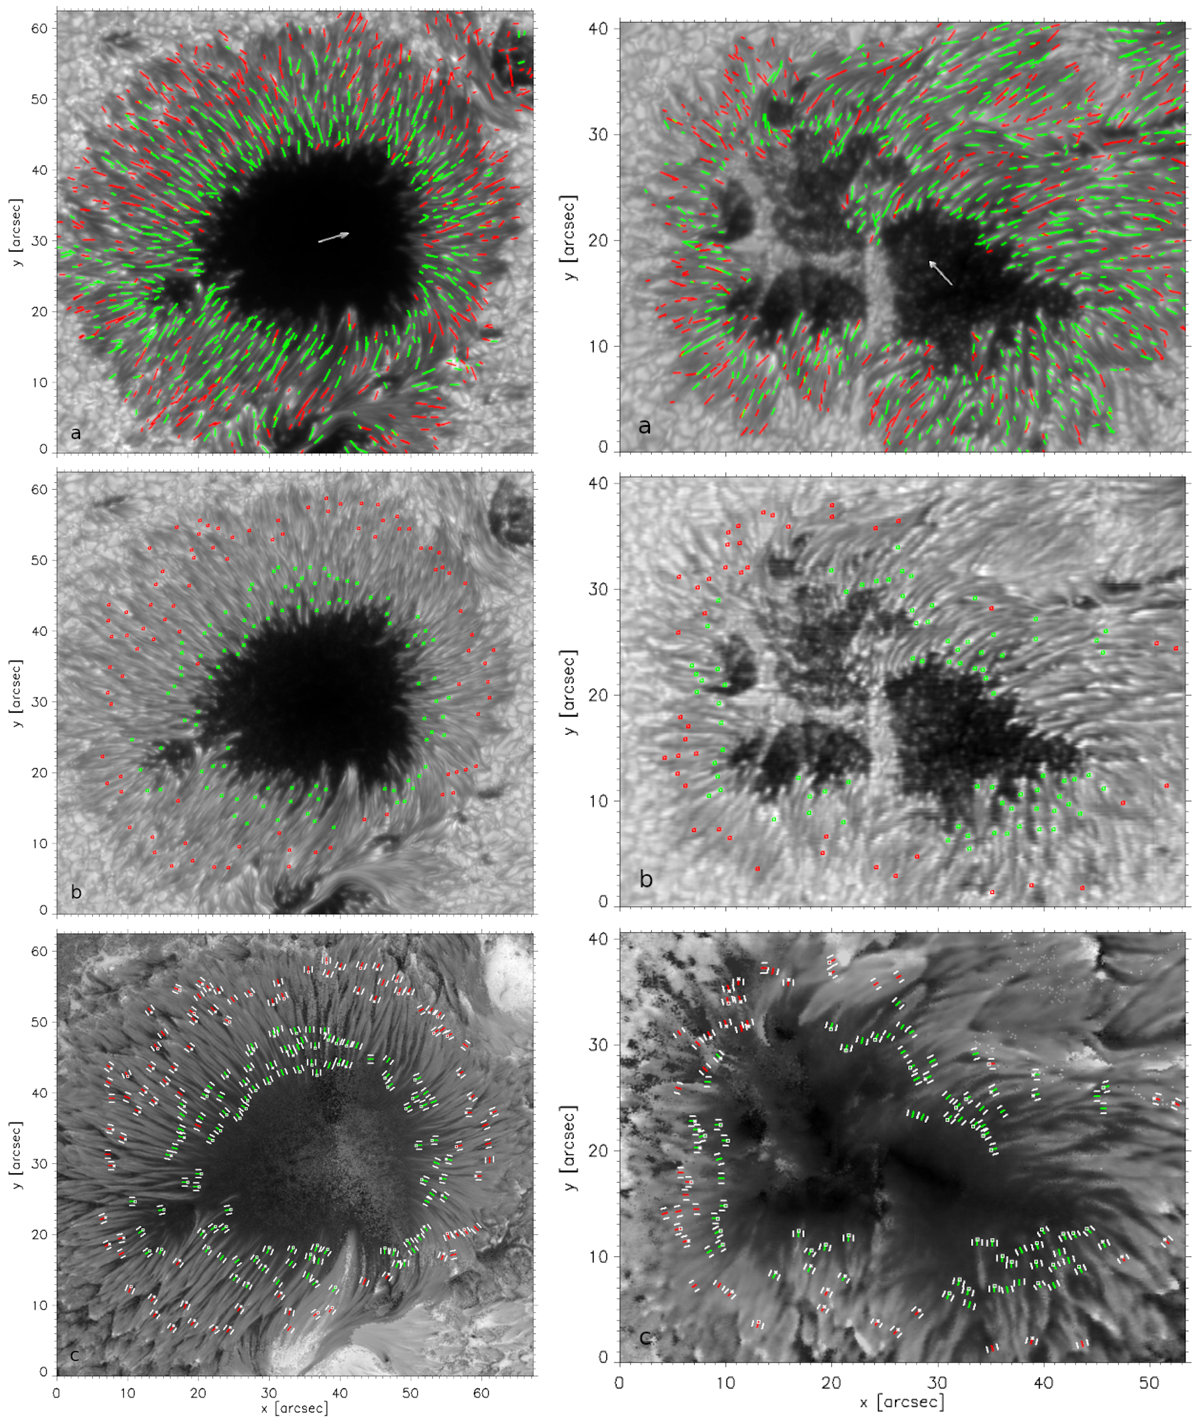
Download original image
Left: Data set 1 (AR 10930); right: Data set 5 (AR 13014). From top to bottom: (a) Trajectories of inward-moving (green) and outward-moving (red) PGs found by feature tracking from the series of broadband images. Arrows point to the disc center. (b) Positions of visually selected PGs (green, red) in the enhanced continuum images. (c) Maps of LRF magnetic inclination (0°–180°) together with line segments (green, red) representing PGs. White lines show locations where the surrounding inclination was measured. Square symbols at the ends of green/red line segments mark class 1 PGs and dots class −1 ones.
Current usage metrics show cumulative count of Article Views (full-text article views including HTML views, PDF and ePub downloads, according to the available data) and Abstracts Views on Vision4Press platform.
Data correspond to usage on the plateform after 2015. The current usage metrics is available 48-96 hours after online publication and is updated daily on week days.
Initial download of the metrics may take a while.