Fig. 2
Download original image
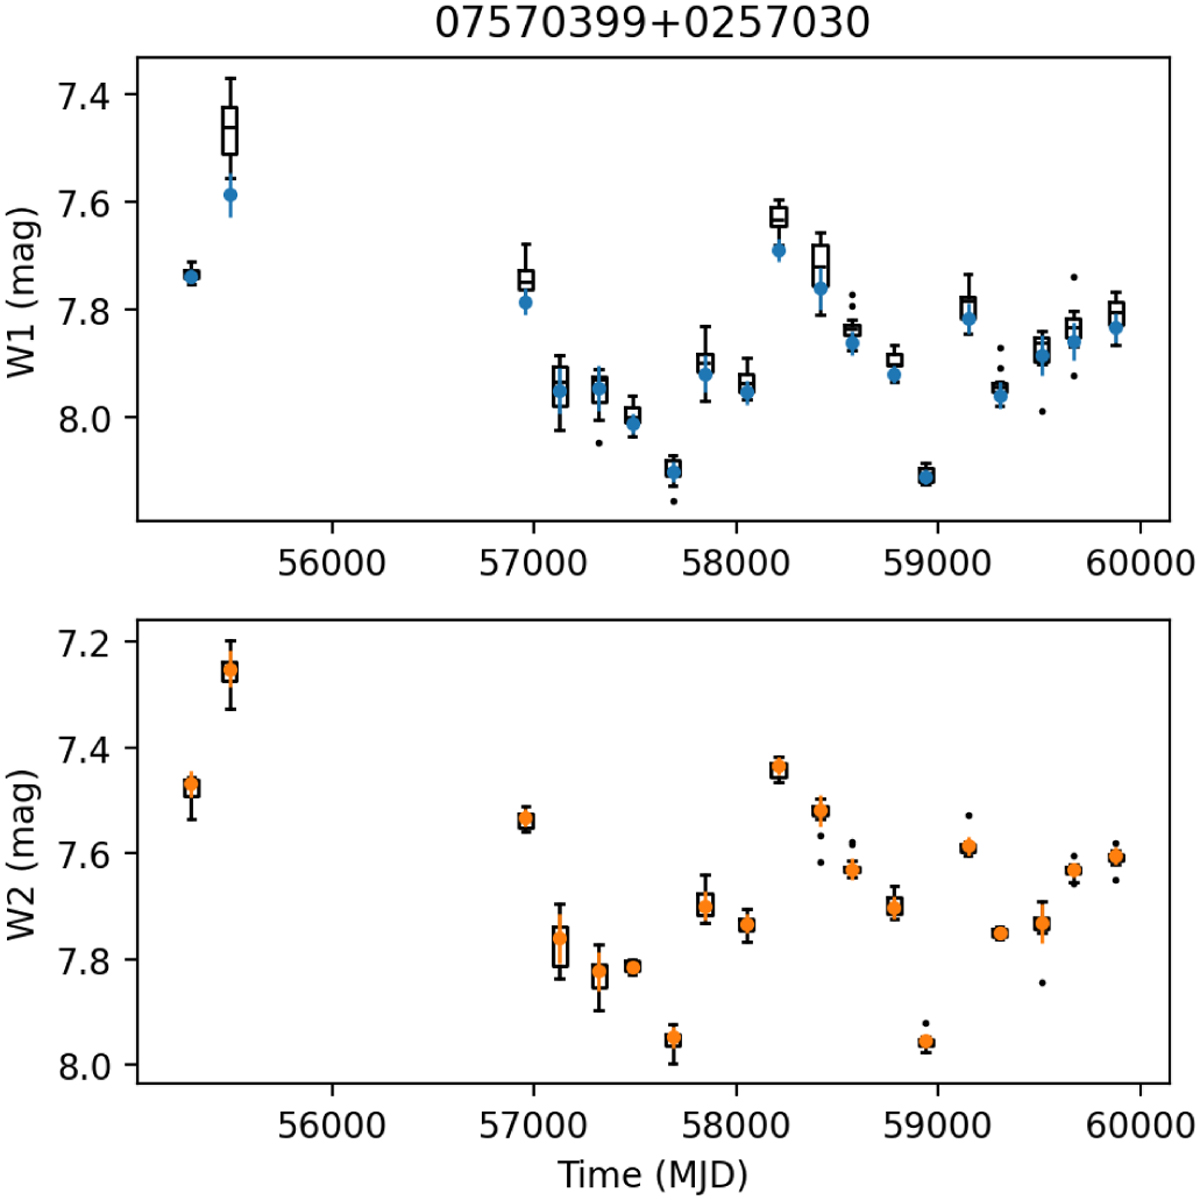
Example of the WISE epoch photometry (box plots with outliers plotted as black dots) and the binned light curve (in blue for W 1 and orange for W2). The saturation correction was performed after the epoch photometry was extracted, and therefore, some part of the binned light curve, especially in W1, is lower than the median of the grey points.
Current usage metrics show cumulative count of Article Views (full-text article views including HTML views, PDF and ePub downloads, according to the available data) and Abstracts Views on Vision4Press platform.
Data correspond to usage on the plateform after 2015. The current usage metrics is available 48-96 hours after online publication and is updated daily on week days.
Initial download of the metrics may take a while.