Open Access
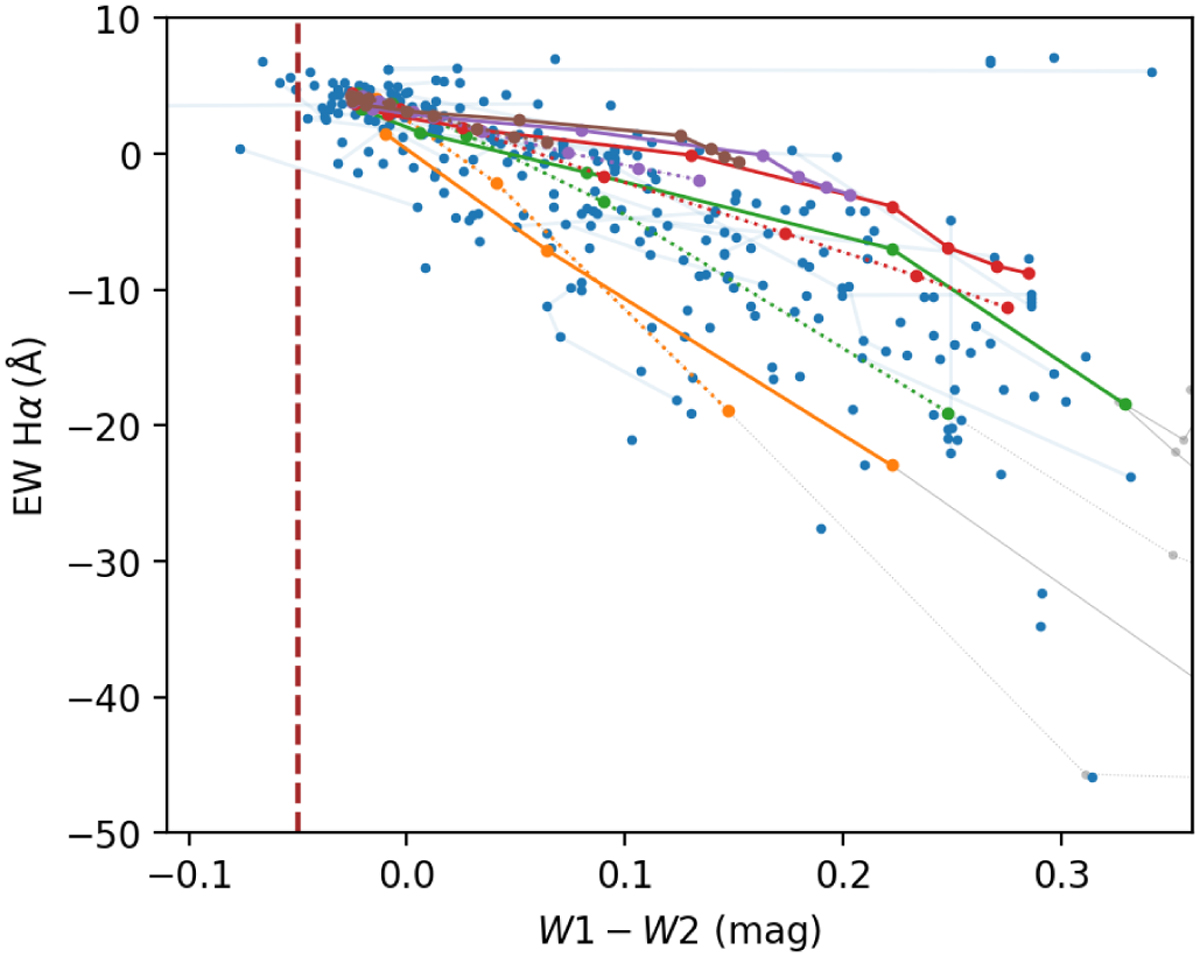
Fig. 12
Download original image
(W1 – W2) colour vs. the EW of the Hα line. The stars with multiple epoch measurements are connected with light blue lines. The model prediction from Granada et al. (2018) is overplotted, and the colour and line style follow those in Fig. 9.
Current usage metrics show cumulative count of Article Views (full-text article views including HTML views, PDF and ePub downloads, according to the available data) and Abstracts Views on Vision4Press platform.
Data correspond to usage on the plateform after 2015. The current usage metrics is available 48-96 hours after online publication and is updated daily on week days.
Initial download of the metrics may take a while.