Fig. 3.
Download original image
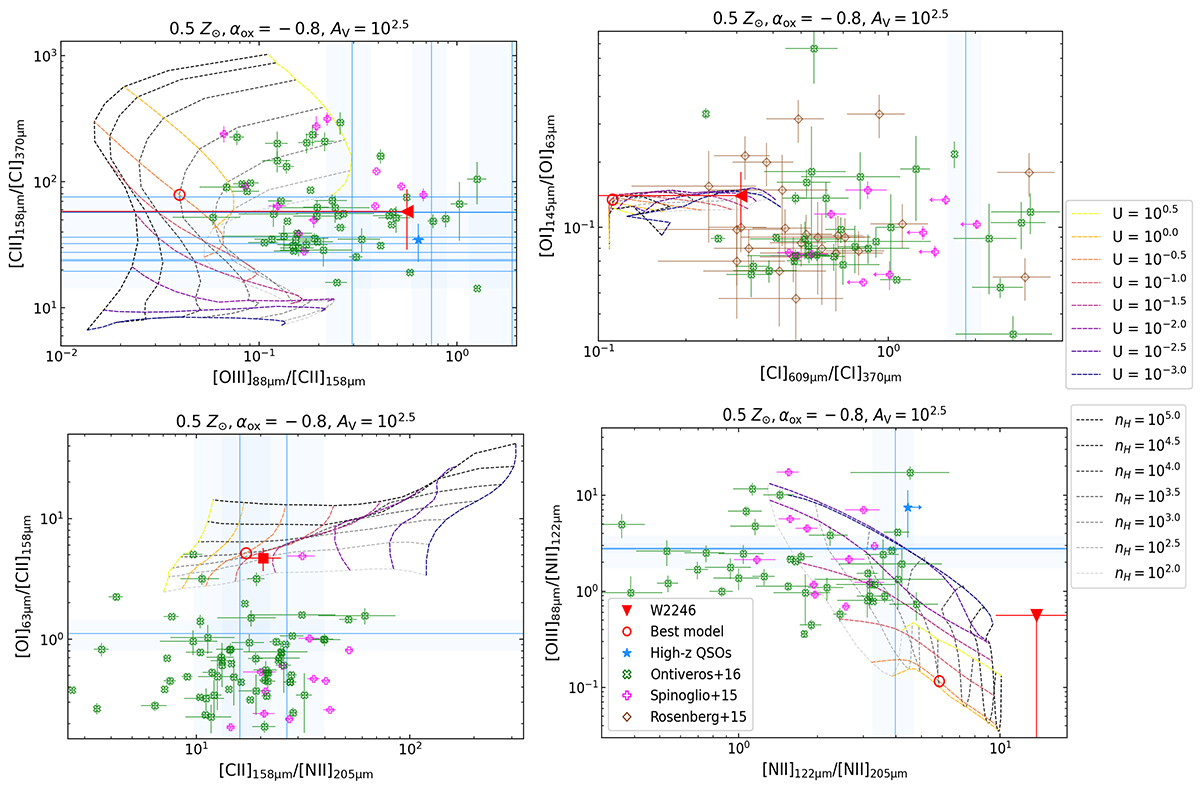
Line ratio diagrams from the CLOUDY models for the metallicity, αox and AV of the model with the lowest ![]() described in Sect. 3.4. The observed line ratios for W2246–0526 are indicated with a red square, and a red triangle for upper limits. The color grid spans the full range of values explored in this work for the ionization parameter and the density, as shown in the legend. The red open circle indicates the best-fit value for our source (i.e., lowest
described in Sect. 3.4. The observed line ratios for W2246–0526 are indicated with a red square, and a red triangle for upper limits. The color grid spans the full range of values explored in this work for the ionization parameter and the density, as shown in the legend. The red open circle indicates the best-fit value for our source (i.e., lowest ![]() model). Literature values for high-z quasars (Weiß et al. 2003; Uzgil et al. 2016; Venemans et al. 2017; Walter et al. 2018; Lee et al. 2019; Novak et al. 2019; Yang et al. 2019; Li et al. 2020; Pensabene et al. 2021; Meyer et al. 2022; Decarli et al. 2022, 2023) are indicated with blue stars, or solid blue lines with shadow uncertainties if only one ratio is available. Literature values for local AGNs are indicated with open green crosses for Fernández-Ontiveros et al. (2016) and open magenta plus signs for Spinoglio et al. (2015), while local ULIRGs from Rosenberg et al. (2015) are indicated with open brown diamonds.
model). Literature values for high-z quasars (Weiß et al. 2003; Uzgil et al. 2016; Venemans et al. 2017; Walter et al. 2018; Lee et al. 2019; Novak et al. 2019; Yang et al. 2019; Li et al. 2020; Pensabene et al. 2021; Meyer et al. 2022; Decarli et al. 2022, 2023) are indicated with blue stars, or solid blue lines with shadow uncertainties if only one ratio is available. Literature values for local AGNs are indicated with open green crosses for Fernández-Ontiveros et al. (2016) and open magenta plus signs for Spinoglio et al. (2015), while local ULIRGs from Rosenberg et al. (2015) are indicated with open brown diamonds.
Current usage metrics show cumulative count of Article Views (full-text article views including HTML views, PDF and ePub downloads, according to the available data) and Abstracts Views on Vision4Press platform.
Data correspond to usage on the plateform after 2015. The current usage metrics is available 48-96 hours after online publication and is updated daily on week days.
Initial download of the metrics may take a while.