Fig. 2.
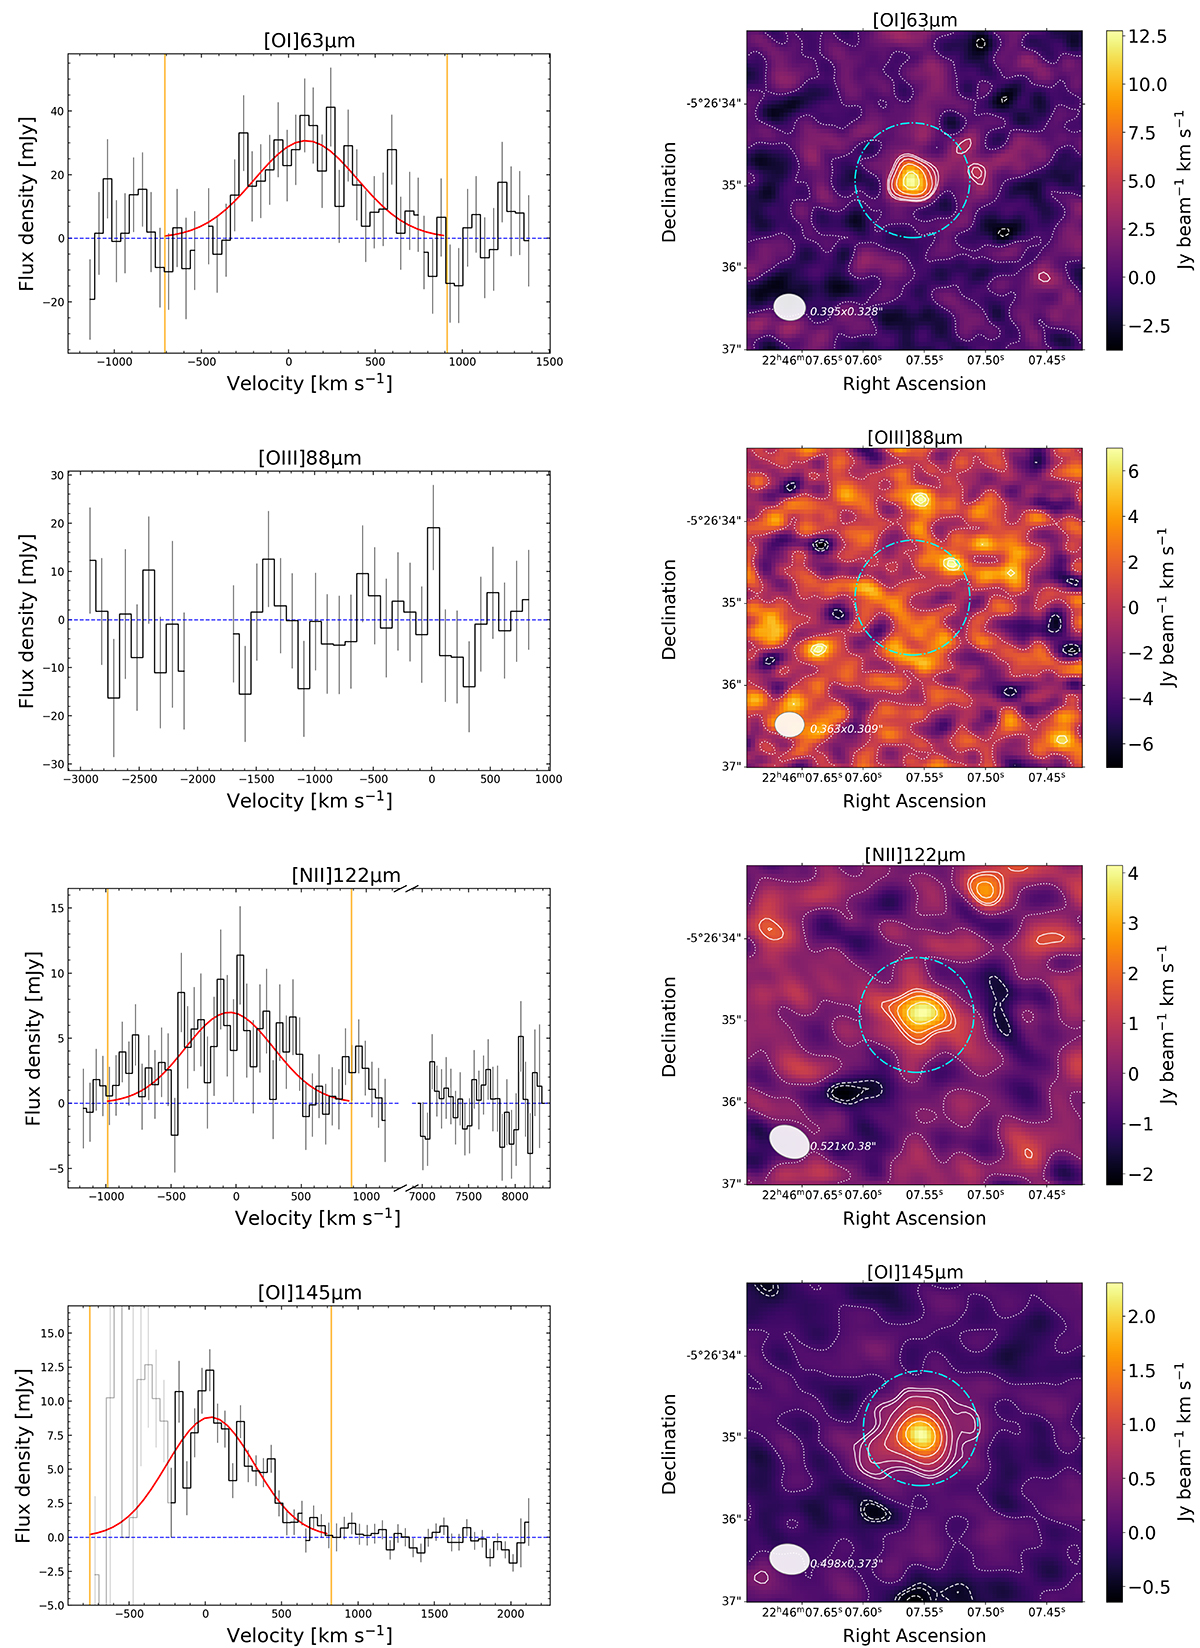
Download original image
Spectra (left) and intensity map (right) for each observed line in W2246–0526. The blue dashed line indicates the zero flux density in each spectrum, the red line is the Gaussian fit for each emission line, and the two orange lines indicate the 2.75σ of each Gaussian fit that is used to integrate the flux of the emission line directly on the spectra. In the intensity maps, the blue dot-dashed line shows the aperture used to extract each spectrum, and the clean beam is shown at the bottom left. The zero-flux intensity level is shown as a white, dotted contour. Solid contours indicate [2.5, 3, 2(4 + n)/2]σ levels (with σ being the rms of the map, and n = [0, 1, 2, …]). Dashed contours show negative flux at the same absolute levels.
Current usage metrics show cumulative count of Article Views (full-text article views including HTML views, PDF and ePub downloads, according to the available data) and Abstracts Views on Vision4Press platform.
Data correspond to usage on the plateform after 2015. The current usage metrics is available 48-96 hours after online publication and is updated daily on week days.
Initial download of the metrics may take a while.