Open Access
Fig. B.2.
Download original image
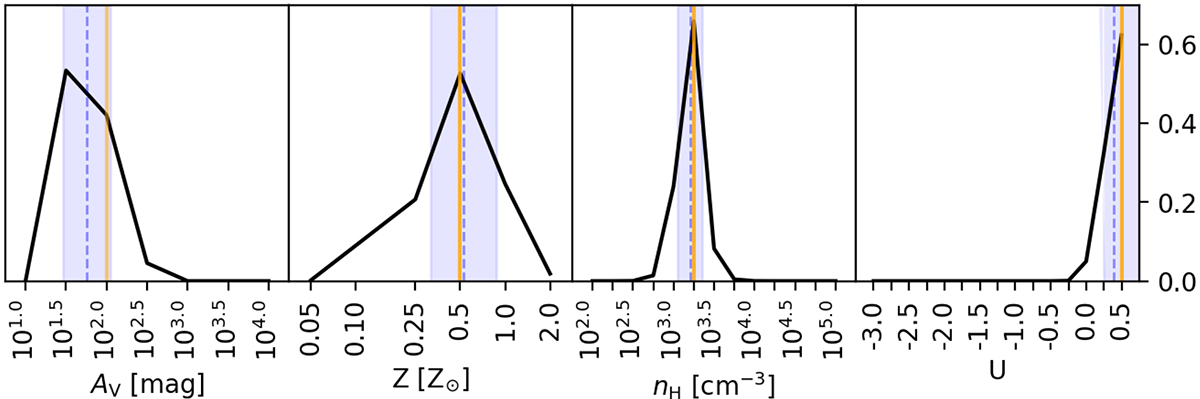
Marginalized 1D posterior probability distributions for each parameter of the models without varying αox. The lines and shaded regions are as defined in Fig. 8.
Current usage metrics show cumulative count of Article Views (full-text article views including HTML views, PDF and ePub downloads, according to the available data) and Abstracts Views on Vision4Press platform.
Data correspond to usage on the plateform after 2015. The current usage metrics is available 48-96 hours after online publication and is updated daily on week days.
Initial download of the metrics may take a while.