Open Access
Fig. B.1.
Download original image
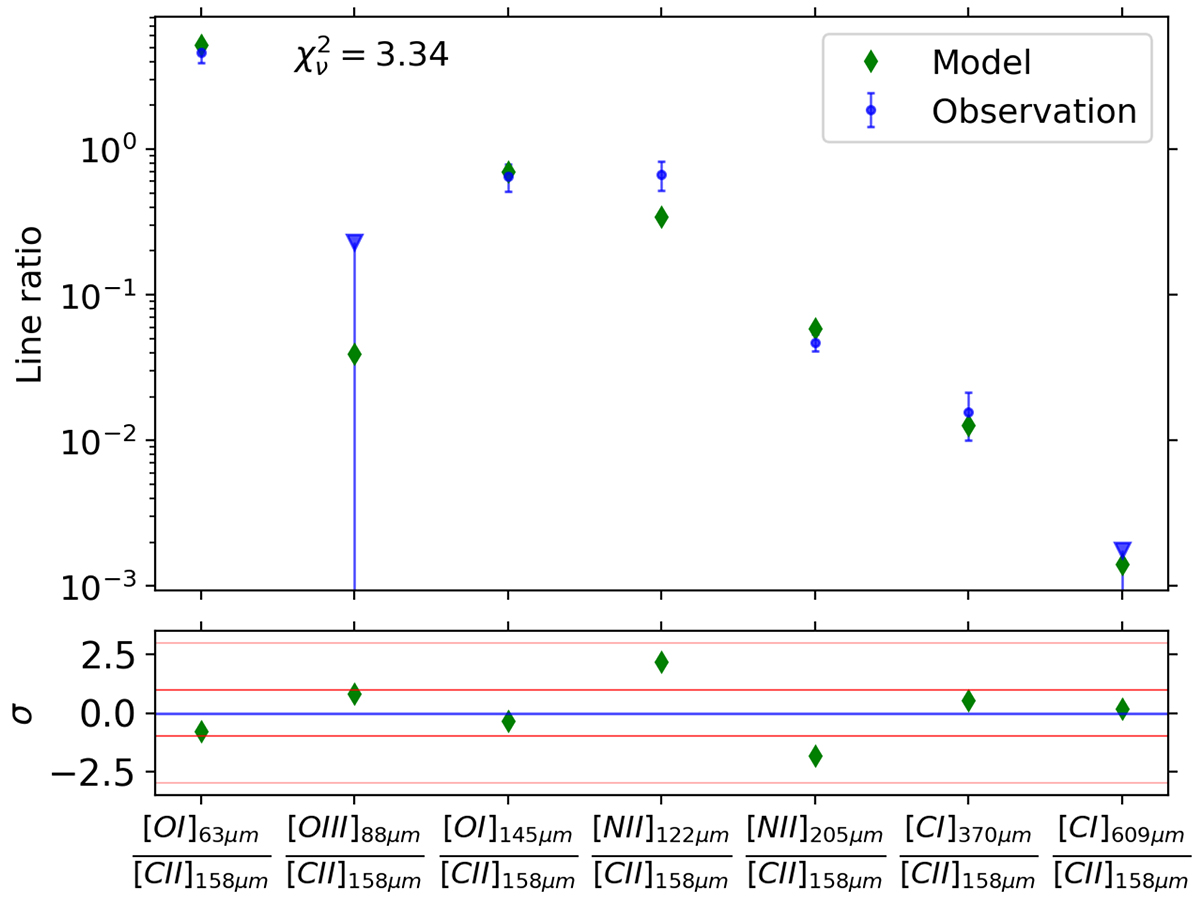
Comparison between the W2246–0526 observed and best-fit model line ratios used for the minimization. The reduced χ2 is shown in the top left. The bottom panel shows the differences between the two in units of standard deviations.
Current usage metrics show cumulative count of Article Views (full-text article views including HTML views, PDF and ePub downloads, according to the available data) and Abstracts Views on Vision4Press platform.
Data correspond to usage on the plateform after 2015. The current usage metrics is available 48-96 hours after online publication and is updated daily on week days.
Initial download of the metrics may take a while.