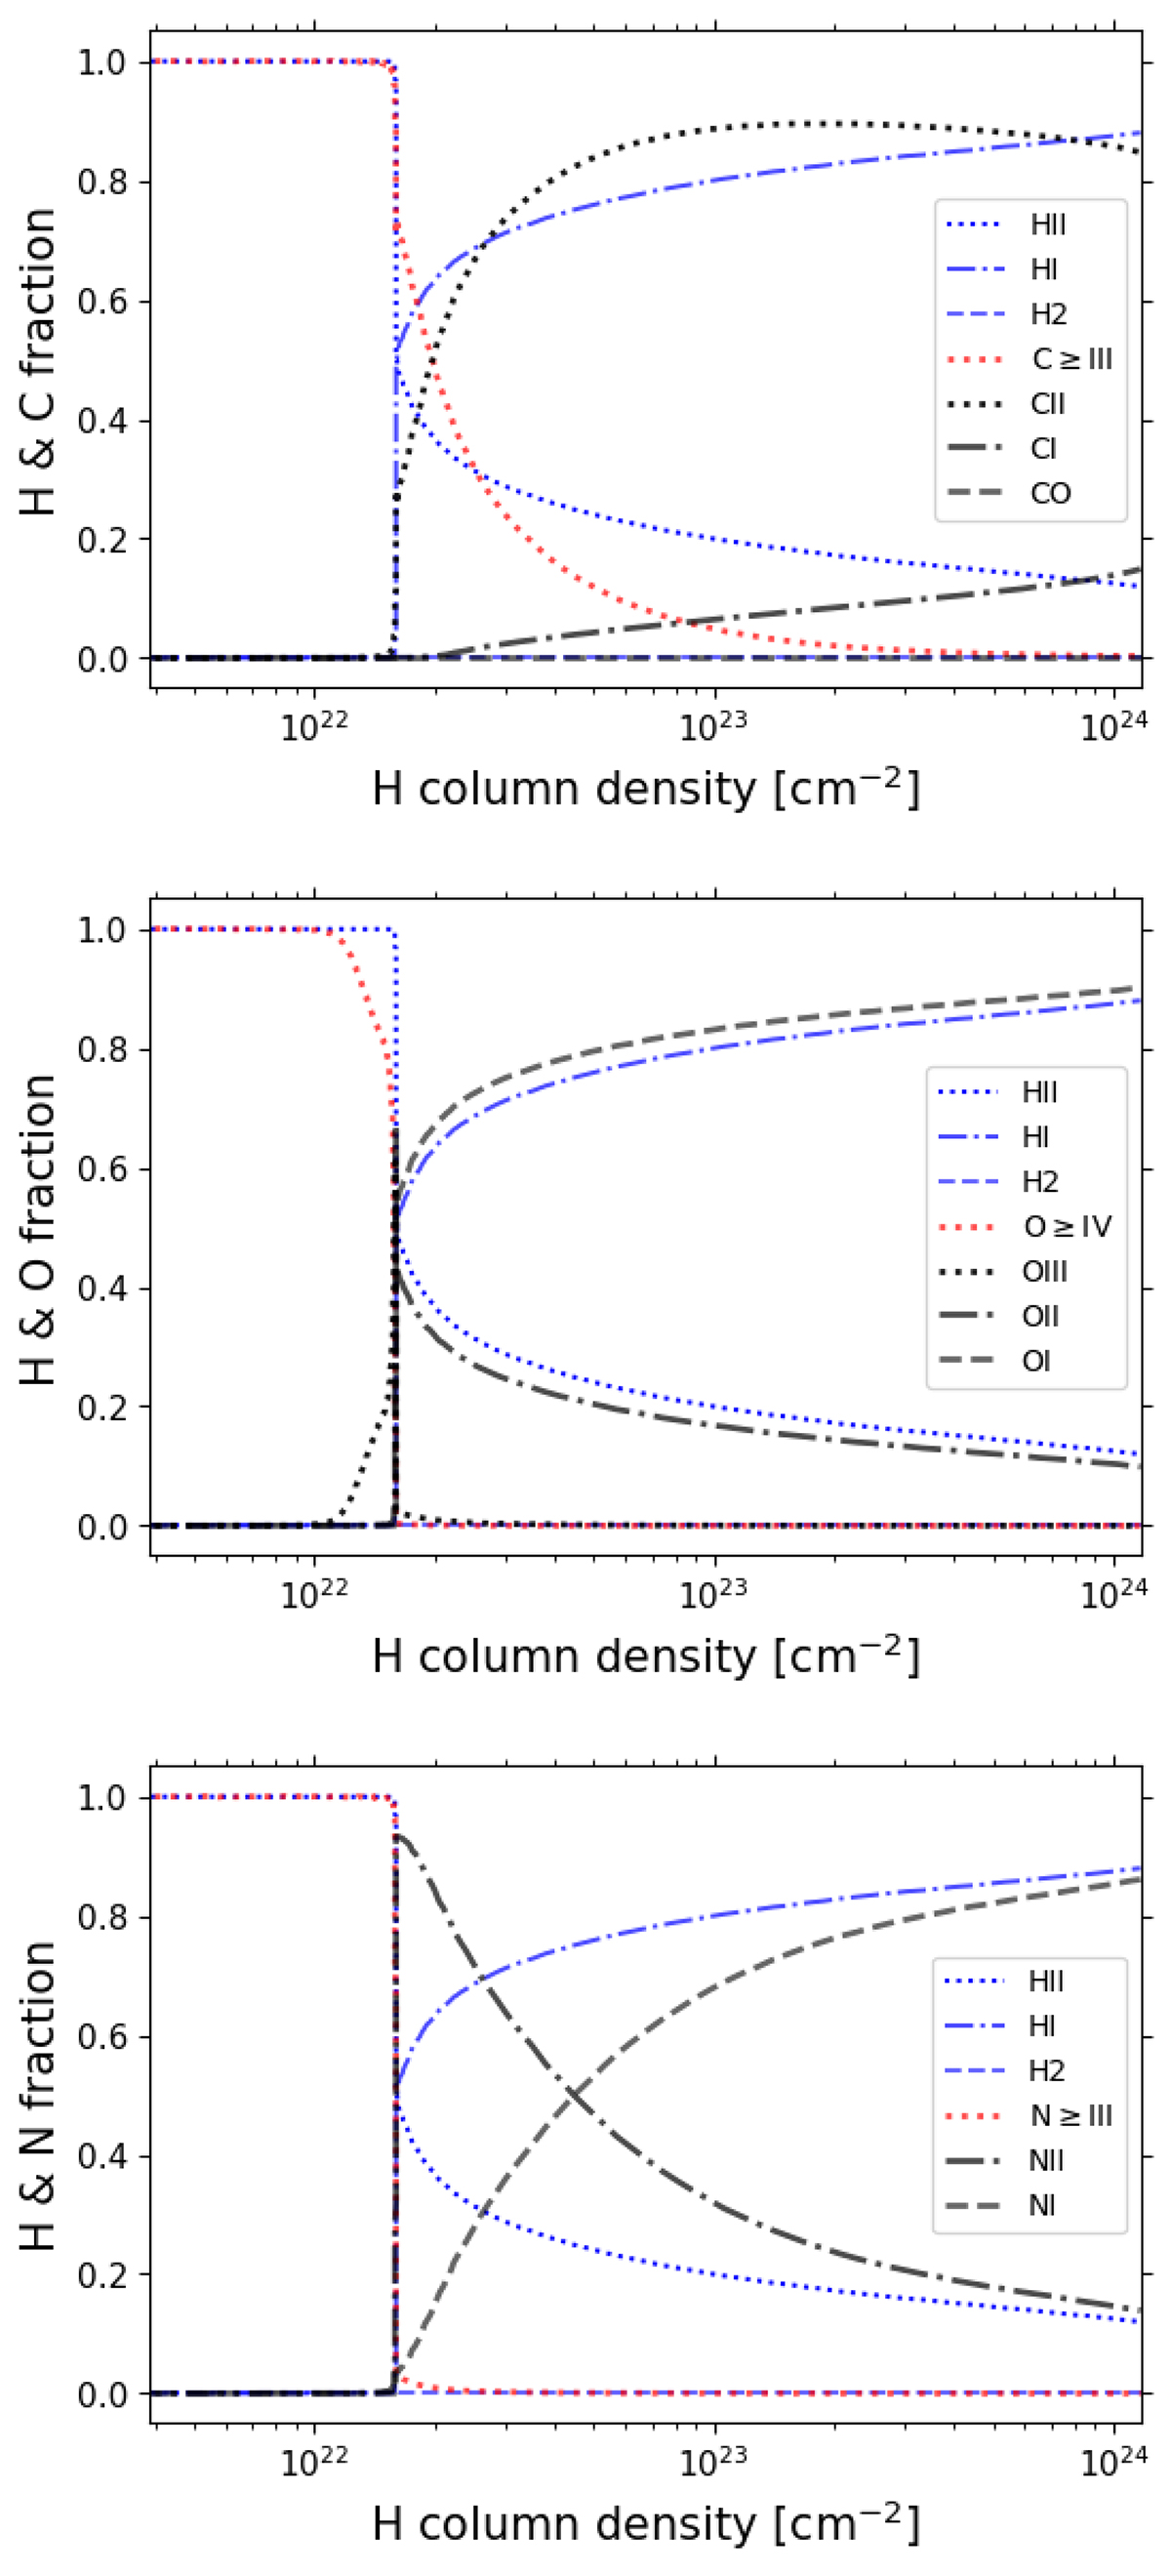
Fig. 9.
Download original image
Cumulative line intensity (top panel) and line emissivity (bottom panel) at each depth in the cloud, for the CLOUDY model that best fits the W2246–0526 observations. Both panels show each modeled FIR fine-structure line as a function of the cloud depth, measured in hydrogen column density. The HII fraction is included to visualize the ionization front, where it drops sharply.
Current usage metrics show cumulative count of Article Views (full-text article views including HTML views, PDF and ePub downloads, according to the available data) and Abstracts Views on Vision4Press platform.
Data correspond to usage on the plateform after 2015. The current usage metrics is available 48-96 hours after online publication and is updated daily on week days.
Initial download of the metrics may take a while.