Fig. 9.
Download original image
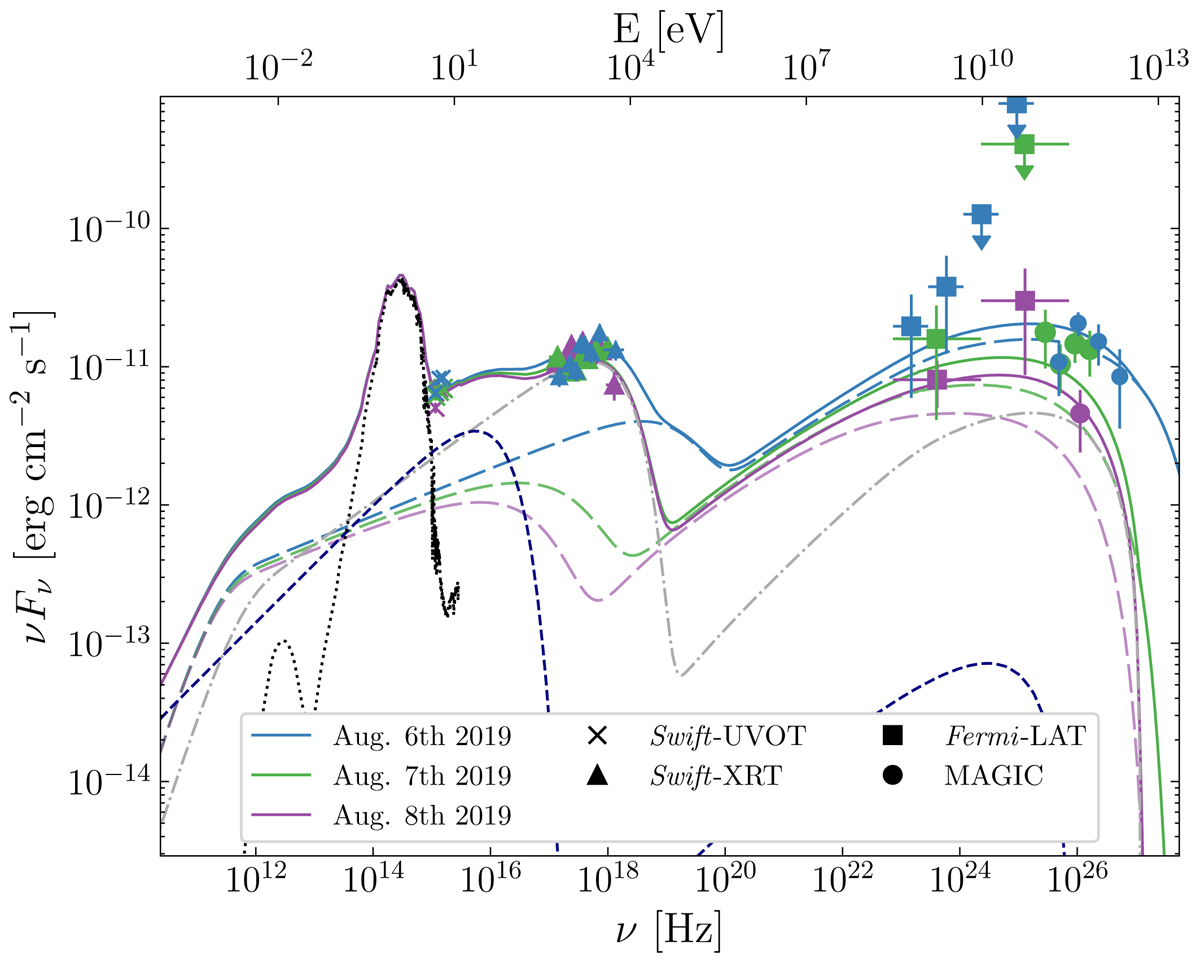
Leptonic modelling of the August 2019 flare. The dash-dotted grey line is the emission from the quiescent component adopting the parameters listed in Table 6. The long dash line is the emission from the flaring component, using the parameters listed in Table 7. While the quiescent component is assumed to be constant over time, the flaring component evolves with time (see text for more details). The short dash blue line depicts the emission from the core component using the same parameters as the one obtained in Sect. 5, Table 5. The dotted black line is the host-galaxy contribution, using a template from the SWIRE database (Polletta et al. 2007). The solid lines are the sum of all components. Each day is plotted with a different colour, while the data from the respective instruments are displayed with distinct markers according to the legend.
Current usage metrics show cumulative count of Article Views (full-text article views including HTML views, PDF and ePub downloads, according to the available data) and Abstracts Views on Vision4Press platform.
Data correspond to usage on the plateform after 2015. The current usage metrics is available 48-96 hours after online publication and is updated daily on week days.
Initial download of the metrics may take a while.