Fig. 8.
Download original image
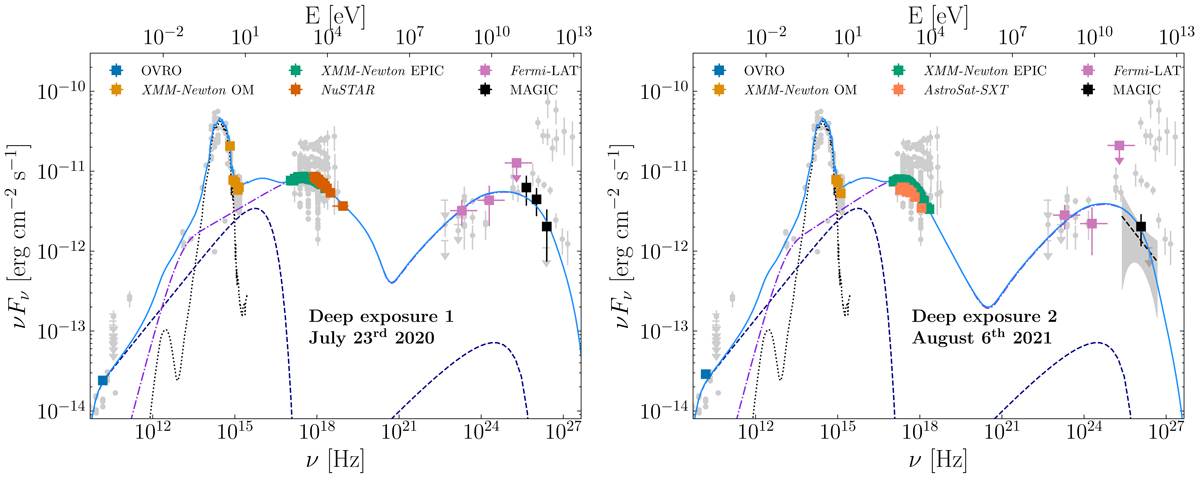
Broad-band SEDs during the simultaneous MAGIC, XMM-Newton, NuSTAR, and AstroSat observations. The panel on the left shows the SED from the deep exposure 1 epoch (July 23, 2020) while the panel on the right is during the deep exposure 2 epoch (August 6, 2021). The results of the 2-component SSC modelling is also shown: the dashed dark-blue line is the emission from the core region, while the violet dash-dotted line is the emission from the variable region (see text for more details). The sum of the two components is plotted in a continuous light-blue line. The parameter values of the model are listed in Table 5. The large bump in the optical domain (black dashed curve) is the emission from the host galaxy modelled with the template from the SWIRE database (Polletta et al. 2007). As in Fig. 7, grey points are archival measurements from the SSDC database.
Current usage metrics show cumulative count of Article Views (full-text article views including HTML views, PDF and ePub downloads, according to the available data) and Abstracts Views on Vision4Press platform.
Data correspond to usage on the plateform after 2015. The current usage metrics is available 48-96 hours after online publication and is updated daily on week days.
Initial download of the metrics may take a while.