Fig. 7.
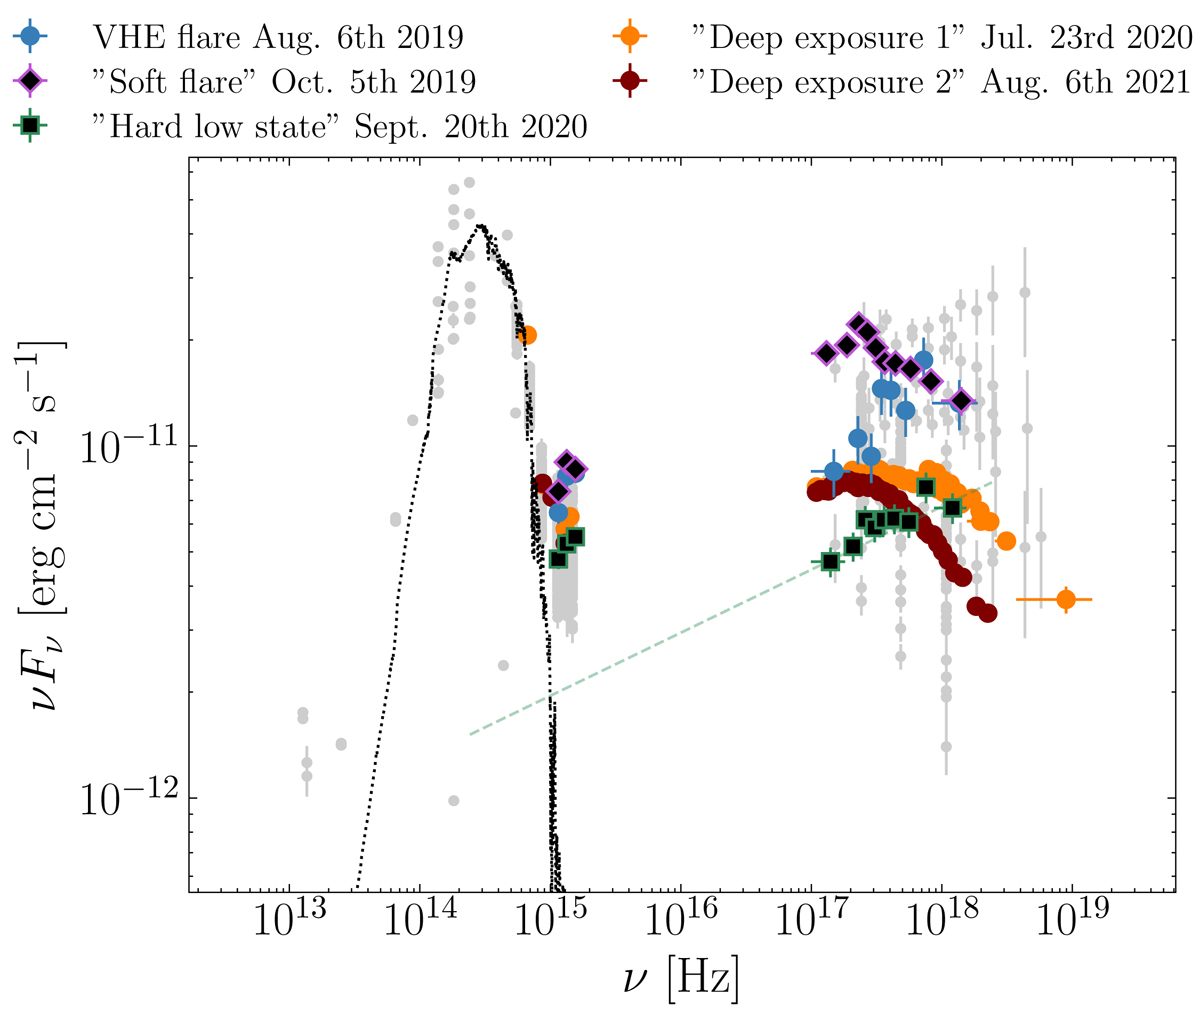
Download original image
Optical/UV and X-ray emission during specific states. The violet markers depict the Swift spectrum during a soft flare on October 5, 2019, during which the power-law index is above 2, indicating a synchrotron peak energy below 1 keV. The green markers display the Swift spectrum during a low but hard state on September 20, 2020. During the latter day, the source is in an EHBL state despite the particularly low flux. An extrapolation of the X-ray best-fit power-law model to lower energy (shown with a green dashed line) suggests a UV excess and possibly indicates a second component contributing to the synchrotron SED. The orange and maroon markers correspond to the deep exposure 1 and deep exposure 2 SEDs. The blue markers represent the Swift spectrum during the VHE flare on August 6, 2019. Grey points are archival measurements from the SSDC database for comparison purposes. The black dotted line is the host-galaxy template, also taken from the SWIRE database.
Current usage metrics show cumulative count of Article Views (full-text article views including HTML views, PDF and ePub downloads, according to the available data) and Abstracts Views on Vision4Press platform.
Data correspond to usage on the plateform after 2015. The current usage metrics is available 48-96 hours after online publication and is updated daily on week days.
Initial download of the metrics may take a while.